Kellanova Corp - K Earnings per share for the last 12 months

Kellanova Company (K) - corporate logo

Kellanova's shift toward high-margin snacks has strengthened cash flow, fueling expansion into African and Latin American markets. The annual EPS TTM growth rate illustrates this trend, with the 25.30 figure serving as the target level. However, final profit dynamics remain sensitive to agricultural raw material costs and global food supply chain disruptions.

Kellanova Corp - K Net earnings per share (EPS TTM) (period 02/11/2024 - 12/27/2025)

K (Kellanova Company): analytical breakdowns and indicator data
Fundamental company valuation:kelloggcompany.com, K
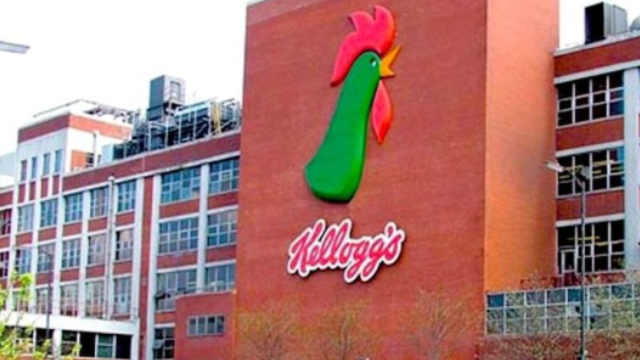
Core merchandise of Kellogg's

The reliability of an equity asset is determined by the business's ability to generate real profit growth above inflation. This indicator captures the daily price action of net earnings per share over twelve months. For Kellanova (K), this calculation reflects the efficiency of its expansion into the snacks and frozen foods segment following restructuring. Analyzing the annual percentage growth of EPS TTM allows for an assessment of capital stability during the business model transformation.

Competitor analysis

Net earnings per one share for the last twelve months kraftheinzcompany.com|GIS: Net earnings per share (EPS TTM)|Earnings per share for the last 12 months MKC|Net earnings per share for the last 12 months JBS|HRL: Earnings per share for the trailing year|Net earnings per share (EPS TTM) SJM|PPC: Earnings per one share for the last 12 months|Earnings per share for the last twelve months Campbell's CPB|Smithfield (SFD) - Net earnings per one share for the last twelve months|INGR - Earnings per share for the last twelve months|Net earnings per one share for the last twelve months Lamb Weston Holdings|BRFS: Net earnings per share (EPS TTM)|Earnings per share for the last 12 months POST|Earnings per share for the last twelve months T. Marzetti|Net earnings per share (EPS TTM) Premier Protein|Net earnings per share (EPS TTM) TR|FLO - Net earnings per one share for the last twelve months|Earnings per share for the last twelve months The Simply Good Foods SMPL|nomadfoods.com - Earnings per share for the last twelve months|KLG - Earnings per share for the last twelve months|JJSF: Earnings per share for the last twelve months|UTZ: Net earnings per share (EPS TTM)|TreeHouse Foods Inc. (THS) - Net earnings per share (EPS TTM)|Earnings per share for the last twelve months SunOpta Inc.|Earnings per share for the last 12 months JBSS (Sanfilippo)|Earnings per share for the last twelve months Seneca Foods Corporation (SENEA)|LWAY - Net earnings per one share for the last twelve months|MamaMancini's - Net earnings per share for the last 12 months|B&G Foods Holding - Earnings per share for the last twelve months|Beyond Burger - Net earnings per share (EPS TTM)|HAIN - Net earnings per share (EPS TTM)|Bridgford Foods Corporation (BRID) - Earnings per share for the last twelve months|Wing Yip Food Holdings (WYHG) - Net earnings per share (EPS TTM)|Earnings per share for the last twelve months Laird Superfood|Borealis Foods, Inc. (BRLS) - Net earnings per share for the last four quarters|Net earnings per share (EPS TTM) FARM|BOF - Net earnings per one share for the last twelve months|Earnings per share for the last twelve months Pinnacle Food Group Inc. PFAI|SOWG - Net earnings per share for the last 12 months|Top Wealth Group Holding Ltd - Net earnings per share (EPS TTM)|Net earnings per share for the last four quarters Steakholder Foods Corp STKH|BSFC (bluestarfoods.com) - Net earnings per share for the last 12 months|Net earnings per share for the trailing year Whole Earth Brands, Inc. FREE|LANC (Lancaster Colony Corporation) - Net earnings per share (EPS TTM)|The Real Good Food Company Inc. - Earnings per one share for the last 12 months|Net earnings per share (EPS TTM) SNAX|Net earnings per share for the last four quarters Sovos Brands Corp