SOWG Sow Good: Net earnings per share for the last four quarters

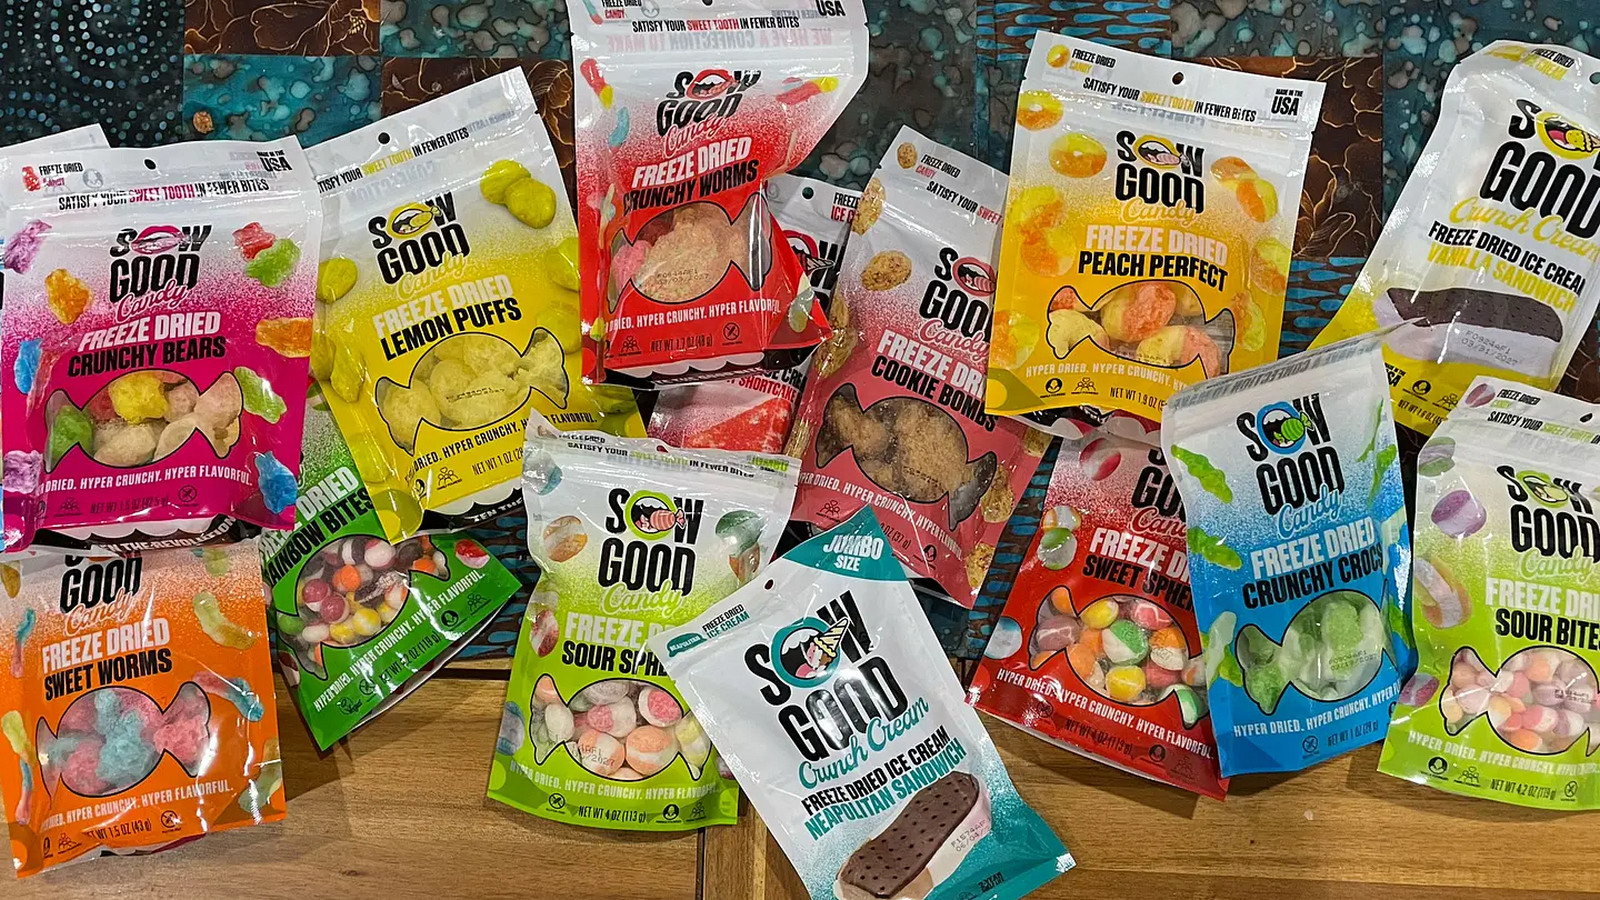
Rising demand for eco-snacks and expanded distribution are driving the business of Sow Good Inc. (SOWG). This chart of YoY TTM earnings per share growth rates confirms this trend, with the current value standing at -671.80. However, high equipment costs and commodity risks are creating pressure. Meanwhile, exceptional customer loyalty to freeze-dried sweets secures the brand's status as a market leader.

Financial and market metric breakdowns for Sow Good (SOWG)
Sow Good Inc. (SOWG) investments in retaining leading sublimation technologists must translate into efficiency measured by the trailing twelve-month (TTM) earnings per share (EPS) trend. This calculation captures the percentage change in EPS TTM relative to the same period last year, allowing the annual EPS TTM growth to quickly signal deviations from the consensus and mitigate losses during asset corrections.
