Flowers Foods Inc - FLO Earnings per share for the trailing year
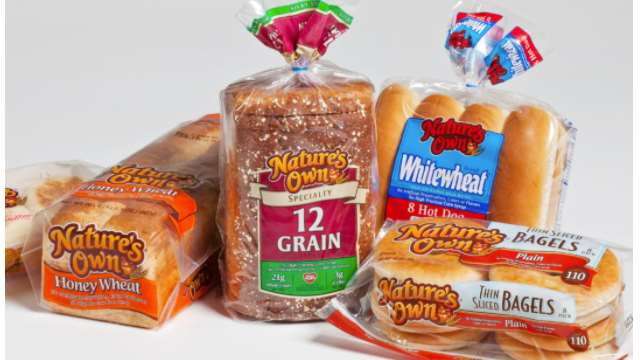
The transition to energy-efficient ovens and electric vehicles optimizes costs for Flowers Foods, Inc. (FLO). The YoY growth in net income per share over the last 12 months on the GURU.Markets daily price chart demonstrates the current trend, where -84.10 shows the actual value of the metric. Revenues are based on the sale of Nature's Own bread, and its status as a defensive asset ensures stable demand regardless of the market cycle.

Flowers Bakeries - analytical breakdowns and key metrics (FLO)
Investors face a choice between minimizing risk and overpaying for an asset as its yield accelerates. The annual growth of basic net income per share (TTM) measures profit dynamics over the last 12 months, reflecting the resilience of Flowers Foods, Inc. (FLO) due to the defensive qualities of the bakery sector and the strength of its iconic brands, which makes this chart a key indicator of the stock's fundamental value.
