SOVO Sovos Brands Inc: Net earnings per share for the last four quarters
The YoY EPS dynamics over the last 12 months on GURU.Markets reflect the current level of the 51.30 metric, confirming the defensive nature of the business. Stable demand for food products minimizes the impact of macroeconomic risks. The Sovos Brands, Inc. (SOVO) team brings together ambitious technologists and marketers focused on expansion. A portfolio of premium sauces and ready-made meals in mass retail guarantees high customer loyalty.

Financial and market metric breakdowns for Sovos Brands, Inc. (SOVO)
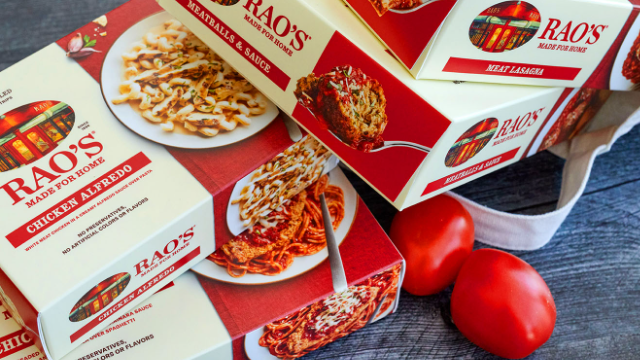
The performance of the premium food segment of Sovos Brands, Inc. (SOVO) is reflected in the year-over-year (TTM) EPS history. This indicator measures the annual growth rate of net income per share. The calculation is based on a comparison of rolling twelve-month periods, eliminating quarterly gaps. This allows for an assessment of the monetization efficiency of the Rao’s and Noosa brands. Steady growth confirms the resilience of the business model and the company's investment attractiveness.
