MULN: Mullen Automotive Inc Price to Sales

Symbol and logo of brand Mullen Motors (MULN)

Mullen Automotive, Inc. (MULN) is expanding its line of commercial vans and passenger vehicles while establishing a closed-loop battery production cycle. The P/S multiple trend clearly demonstrates valuation volatility, where the value 0.00 describes the current level. However, the startup remains susceptible to severe macroeconomic shocks and credit cycles. The absence of stable cash flow and continuous share dilution confirm the company's deep operational deficit.

MULN (mullenusa.com) Market Cap to Revenue history from 08/20/2023 to 07/28/2025

Mullen Motors (MULN) - metric breakdowns and financial figures
- current price and projected stock value:
- market capitalization information:
Summary company analytics:Mullen Automotive
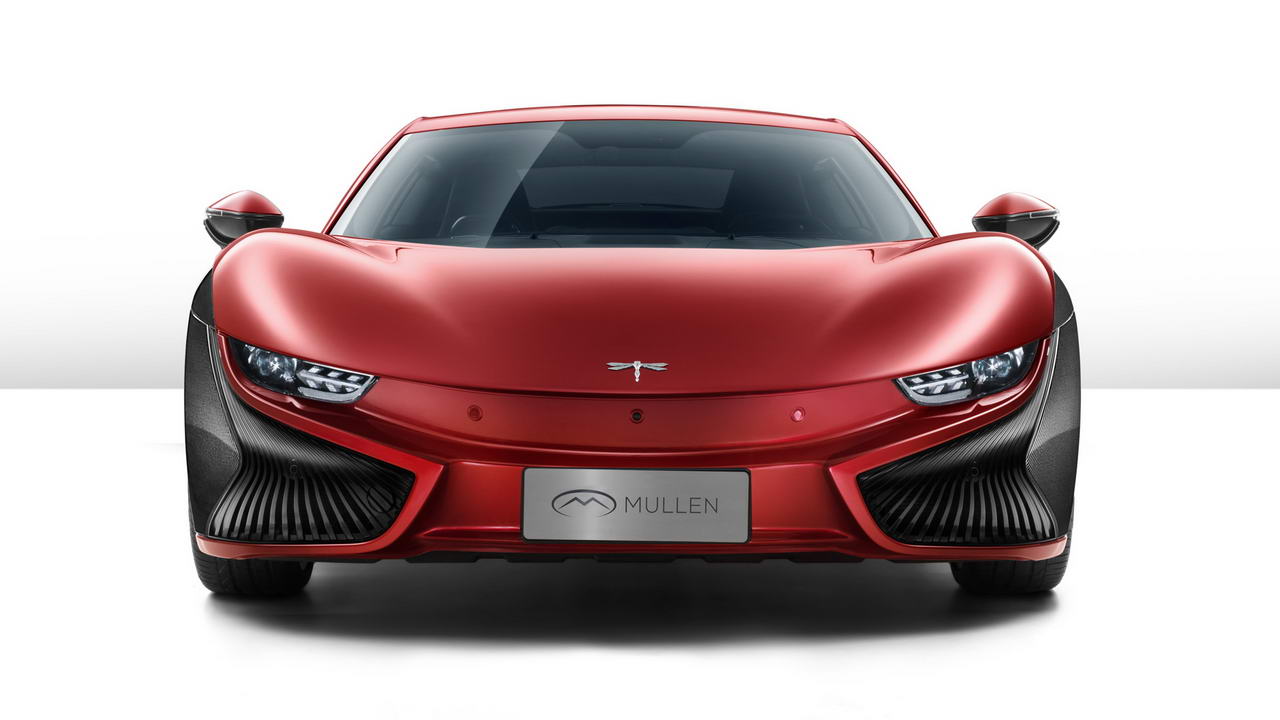
Signature product of Mullen Automotive Inc

The P/S ratio reflects the market value of Mullen Automotive, Inc. (MULN) relative to its annual revenue, allowing for an assessment of the premium paid per unit of generated income. By analyzing the P/S chart, an investor can determine the fairness of the valuation for Mullen Automotive, Inc. (MULN), considering its strategic transition to mass production of electric vehicles and the implementation of solid-state batteries through technological partnerships with logistics operators.

Competitors of Mullen Automotive, Inc.

Price-to-Revenue Ratio TSLA (Tesla)|Price-to-Revenue Ratio lixiang.com LI|P/S Multiple Rivian Corp RIVN|XPEV: Market Cap to Revenue|NIO Inc. (NIO) - Market Cap to Revenue|JOBY (Joby Aviation) - Market Cap to Revenue|ZK: Market Cap to Sales Volume|VFS (VinFast Auto Ltd.) - P/S Multiple|LCID: Market Capitalization-to-Revenue Ratio|Price-to-Revenue Ratio QuantumScape Inc. (QS)|PSNY (Polestar Automotive) - Market Capitalization-to-Revenue Ratio|Price-to-Revenue Ratio Enovix ENVX|Amprius Technologies, Inc. (AMPX) - Price to Sales|EVGO: Market Cap to Revenue|Price to Sales Lotus Corp|Microvast (MVST) - Price-to-Revenue Ratio|Price to Sales LiveWire (LVWR)|SLDP (Solid Power Inc) - P/S Multiple|Robo.ai (AIIO) - Price-to-Revenue Coefficient|Price-to-Revenue Ratio Hyliion Holdings Corp. (HYLN)|NIU - Price to Sales|P/S Multiple ELVA (electrovaya.com)|FFAI (Faraday Future) - Price-to-Sales Ratio|ChargePoint Network - P/S Multiple|Price to Sales American Battery Technology Company|NVX (NOVONIX Limited) - Market Cap to Revenue|Price to Sales Blink Charging Co. (BLNK)|Price-to-Revenue Ratio kandivehicle.com|Price to Sales cbak.com.cn CBAT|Market Cap to Revenue WBX (Wallbox N.V.)|Market Cap to Sales Volume XCH|Price-to-Revenue Ratio Jiuzi Holdings JZXN|Market Cap to Sales Volume BEEM (Envision Solar)|ZOOZ - Price-to-Revenue Ratio|cenntroauto.com - Market Cap to Sales Volume|Stardust Power Inc. (SDST) - Price-to-Revenue Ratio|GTEC - Price-to-Revenue Coefficient|EPOW (sunrisenewenergy.com) - P/S Multiple|xostrucks.com (XOS) - Price-to-Revenue Coefficient|P/S Multiple DFLI|Price-to-Revenue Coefficient Workhorse Group Inc.|Price-to-Revenue Ratio Elong Power ELPW|Price-to-Revenue Coefficient Sono Motors (SSM)|FLYE - Price-to-Revenue Ratio|Price-to-Revenue Coefficient solidiontech.com STI|GP: P/S Multiple|Market Cap to Revenue U Power Limited|Market Cap to Revenue EVTV|Market Cap to Revenue Lobo EV Technologies Ltd (LOBO)|Price-to-Revenue Ratio Nuvve Holding Corp (NVVE)|Market Cap to Sales Volume CJET|Price-to-Revenue Ratio NaaS Technology Inc. NAAS|EZGO - Market Cap to Revenue|BINI - Price-to-Revenue Ratio|Scage International Limited (SCAG) - Market Cap to Revenue|Thunder Power EV (AIEV) - Price-to-Revenue Ratio|ALLG - Price-to-Revenue Coefficient|Price-to-Revenue Ratio ayro.com|Price to Sales Faraday Future FFIE|Price-to-Revenue Ratio Canoo Inc. (GOEV)|Hyzon - Market Cap to Revenue Ratio|Price-to-Revenue Ratio Lion Electric Co LEV|PEV: Market Cap to Revenue Ratio|SVMH - Price-to-Revenue Ratio|VLCN: Price-to-Revenue Ratio|Zapp Electric Vehicles Group Limited (ZAPP) - Price-to-Revenue Ratio|Market Cap to Revenue Fisker Automotive