Penguin Solutions, Inc. (PENG): Price-to-Sales Ratio
Symbol and logo of brand Penguin Corp (PENG)

Rising demand for edge computing and AI infrastructure is driving the growth of Penguin Solutions Inc (PENG). The price-to-sales multiple on this GURU.Markets chart illustrates the real-time valuation, where the value of 1.70 characterizes this level. Revenues are based on the creation of HPC clusters and server equipment, while a strategic focus on strong architects guarantees the company stable technological progress.

PENG Penguin Solutions, Inc. Price-to-Revenue Ratio (07/04/2022 - 11/13/2026)

Smart Global Holdings (PENG) - metric breakdowns and financial figures
- stock quotes and analyst forecast:
General company analysis:PENG, penguinsolutions.com
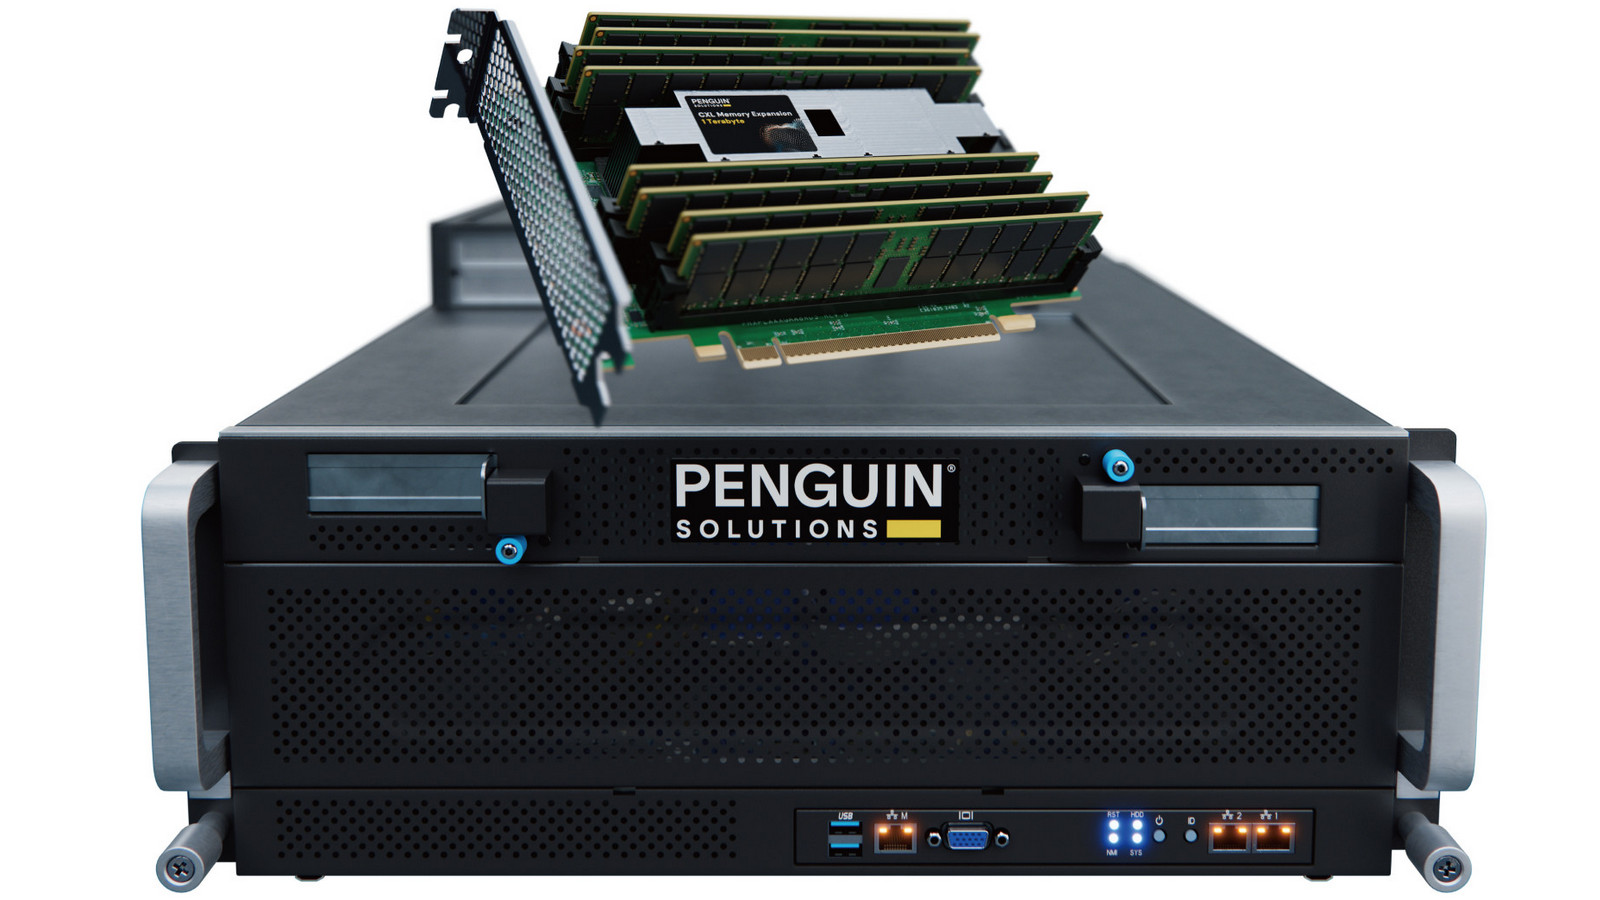
Manufactured product of Smart Global Holdings

Penguin Solutions Inc (PENG) specialization in AI infrastructure and high-performance computing makes revenue a key value driver, which is reflected in the P/S ratio comparing market capitalization to sales volume. By analyzing the P/S chart, an investor determines the price per unit of revenue, identifying whether the asset is overbought or the business is undervalued relative to its ability to generate cash flow.

Competitors of Penguin Solutions Inc

Market Cap to Sales Volume MSFT|Price-to-Revenue Ratio Alphabet GOOG|AMZN (Amazon.com) - Price-to-Sales Ratio|Meta Platforms - P/S Multiple|Price to Sales Spotify AB|Sea Limited (SE) - Price-to-Revenue Ratio|Market Cap to Revenue Ratio NET|RDDT (Reddit) - P/S Multiple|EBAY - Price-to-Revenue Multiple|Market Cap to Revenue BIDU (Baidu Corp)|P/S Multiple VeriSign Corporation (VRSN)|P/S Multiple PINS (Pinterest, Inc.)|Price-to-Revenue Coefficient godaddy.com (GDDY)|SNAP - Price-to-Revenue Ratio|AKAM (Akamai Technologies, Inc.) - Market Cap to Revenue Ratio|MTCH (Tinder) - Market Cap to Revenue|StubHub Inc. - Market Capitalization-to-Revenue Ratio|Price-to-Revenue Ratio Etsy, Inc.|rumble.com (RUM) - Price-to-Revenue Coefficient|Price-to-Revenue Ratio Grindr (GRND)|IAC - Price to Sales|Price-to-Revenue Ratio Yelp.com YELP|Weibo Inc. - Price-to-Revenue Ratio|PLTK: Market Cap to Revenue|VMEO - P/S Multiple|MOMO (Hello Group) - Market Cap to Revenue|FVRR: Market Cap to Sales Volume|GRPN (Groupon Corp) - P/S Multiple|Nextdoor Platform (NXDR) - Price-to-Revenue Coefficient|Price-to-Revenue Ratio NerdWallet, Inc. (NRDS)|NTGR - Price to Sales|Price-to-Revenue Ratio Getty Images GETY|ANGI: Market Cap to Revenue Ratio|BMBL - Price-to-Revenue Ratio|Price-to-Revenue Coefficient Xunlei Network XNET|SOHU (Sohu.com Limited) - Market Cap to Revenue|tssiusa.com - Market Capitalization-to-Revenue Ratio|ZH (Zhihu) - P/S Multiple|Triller Inc. (ILLR) - Price-to-Revenue Coefficient|Price-to-Revenue Ratio Baozun Inc (BZUN)|ON24 Inc - Market Cap to Revenue Ratio|P/S Multiple DOYU (DouYu International)|HKD - Market Cap to Revenue|GAIA - Price-to-Revenue Ratio|Price-to-Sales Ratio VSME|GDC: P/S Multiple|Price to Sales Sound Group (SOGP)|Price-to-Revenue Ratio LiveOne Inc.|Market Cap to Revenue Ratio ZDGE (zedge.net)|P/S Multiple MYND|FiEE Inc. (FIEE) - Price-to-Revenue Multiple|36Kr Holdings Inc - Market Cap to Revenue|Market Cap to Sales Volume FENG (iFeng)|TEN Events - P/S Multiple|Market Capitalization-to-Revenue Ratio DUO (Fangdd Network Group)|NCPL: P/S Multiple|Price to Sales Hanryu Holdings, Inc. (GITS)|Market Cap to Revenue MYSE|TNMG: Market Capitalization-to-Revenue Ratio|P/S Multiple CHR|Price-to-Revenue Coefficient ipdnusa.com|Price-to-Revenue Ratio Onfolio Holdings ONFO|PTRN: Market Cap to Revenue Ratio|DATS: Market Cap to Revenue|Grom Social Enterprises - Market Cap to Sales Volume|HRYU: P/S Multiple|Price to Sales loop.tv (LPTV)|Price-to-Revenue Ratio PropertyGuru|YY: Market Capitalization-to-Revenue Ratio