NETGEAR Inc (NTGR): Market Cap to Revenue Ratio

Symbol and logo of brand NETGEAR Inc (NTGR)

The price-to-sales ratio indicates liquidity stabilization driven by the reduction of excess inventory, with 0.80 representing the latest metric reading. NETGEAR, Inc. (NTGR) is deploying premium Wi-Fi 7 systems and SaaS security. Management is transforming the sales model by shifting toward subscription services to enhance margins and revenue stability.

NTGR NETGEAR Corp Market Cap to Revenue (07/04/2022 - 11/13/2026)

Analytical breakdowns for Netgear (NTGR)
- stock quotes and analyst forecast:
- stock exchange capitalization data:
General company analysis:NTGR netgear.com
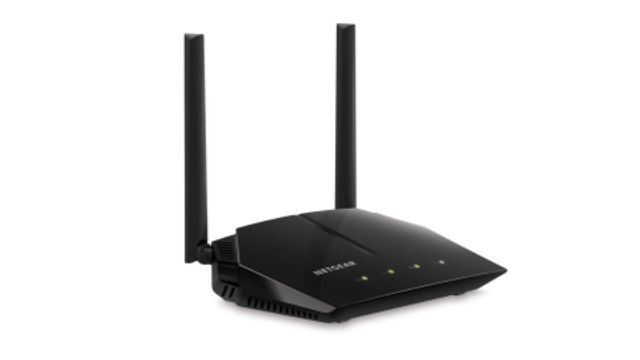
Manufactured product of NETGEAR

The P/S ratio reflects the market value of the company relative to its annual sales volume, allowing for an assessment of the premium investors are willing to pay per unit of revenue. An analysis of the revenue multiple for NETGEAR, Inc. (NTGR) confirms the asset's resilience at the maturity stage, where stable revenues from cloud communication infrastructure offset macroeconomic risks and ensure a predictable business valuation.

Competitors of NETGEAR, Inc.

Market Cap to Sales Volume MSFT|Price-to-Revenue Ratio Alphabet GOOG|AMZN: Market Cap to Revenue Ratio|Meta Platforms - P/S Multiple|Price to Sales Spotify AB|SE (Sea Limited) - Market Cap to Revenue|NET: Market Cap to Sales Volume|RDDT (Reddit) - P/S Multiple|EBAY - Price-to-Revenue Multiple|P/S Multiple BIDU|VRSN - Price to Sales|P/S Multiple PINS (Pinterest, Inc.)|P/S Multiple godaddy.com GDDY|SNAP - Price-to-Revenue Ratio|Market Capitalization-to-Revenue Ratio AKAM (Akamai Technologies, Inc.)|MTCH (Tinder) - Market Cap to Revenue|StubHub Inc. - Market Capitalization-to-Revenue Ratio|ETSY (Etsy, Inc.) - P/S Multiple|rumble.com (RUM) - Price-to-Revenue Coefficient|Price-to-Revenue Ratio Grindr (GRND)|iac.com - Market Cap to Revenue Ratio|P/S Multiple YELP (Yelp.com)|WB - Market Cap to Revenue|PENG: Market Cap to Revenue|Price-to-Revenue Coefficient playtika.com PLTK|Vimeo (VMEO) - Price-to-Revenue Ratio|Market Cap to Revenue Ratio MOMO|Market Cap to Revenue FVRR|GRPN (Groupon.com) - Market Cap to Sales Volume|P/S Multiple NXDR|nerdwallet.com (NRDS) - Price-to-Revenue Multiple|Price-to-Revenue Ratio Getty Images GETY|Market Capitalization-to-Revenue Ratio ANGI|BMBL: Market Cap to Revenue|Xunlei Network - Market Cap to Sales Volume|SOHU: P/S Multiple|tssiusa.com - Market Capitalization-to-Revenue Ratio|ZH (Zhihu) - P/S Multiple|Price to Sales Triller Inc. ILLR|Market Cap to Revenue BZUN (Baozun Inc)|ONTF (ON24 Inc) - Market Capitalization-to-Revenue Ratio|P/S Multiple DOYU (DouYu International)|Price-to-Revenue Coefficient amtdigital.net (HKD)|GAIA - Price-to-Revenue Ratio|VSME (VS MEDIA Holdings Ltd.) - Market Cap to Revenue Ratio|GDC (ccnctech.com) - Market Cap to Revenue|SOGP: Market Cap to Sales Volume|LVO (LiveOne Inc.) - P/S Multiple|Price to Sales zedge.net ZDGE|Price-to-Revenue Ratio Mynd.ai, Inc. (MYND)|FIEE (FiEE Inc.) - Market Capitalization-to-Revenue Ratio|Price-to-Revenue Ratio 36Kr Holdings Inc KRKR|FENG: Market Cap to Revenue Ratio|TEN Events - P/S Multiple|Price to Sales Fangdd Network Group|NCPL (netcapitalinc.com) - Market Cap to Revenue|GITS: Market Cap to Sales Volume|Price-to-Revenue Ratio DatChat|Market Cap to Revenue Ratio TNMG (TNL Mediagene Inc)|P/S Multiple CHR|IPDN - Price to Sales|Onfolio Holdings - Market Cap to Revenue|Market Cap to Sales Volume PTRN (Pattern)|DatChat, Inc - P/S Multiple|Price-to-Revenue Multiple Grom Social Enterprises (GROM)|HRYU: P/S Multiple|Price to Sales loop.tv (LPTV)|PGRU (PropertyGuru) - P/S Multiple|P/S Multiple YY Inc.