Sound Group Inc (SOGP): Price-to-Revenue Coefficient
Corporate company logo of Sound Group Inc (SOGP)

Seamless cloud hosting minimizes infrastructure risks for Sound Group Inc. (SOGP), as evidenced by the P/S ratio history. Market capitalization growth is supported by expansion into Asia and the implementation of AI. Revenues are based on the sale of digital gifts and subscriptions to audio services. The current 0.10 indicator expresses the state of the metric, helping to assess the fairness of the market value relative to the company's actual sales volumes.

SOGP soundgroupinc.com Market Cap to Revenue (02/21/2024 - 11/13/2026)

Analytical breakdowns for Sound Group Inc. (SOGP)
- stock quotes and analyst forecast:
Summary company analytics:Sound Group, Inc., SOGP
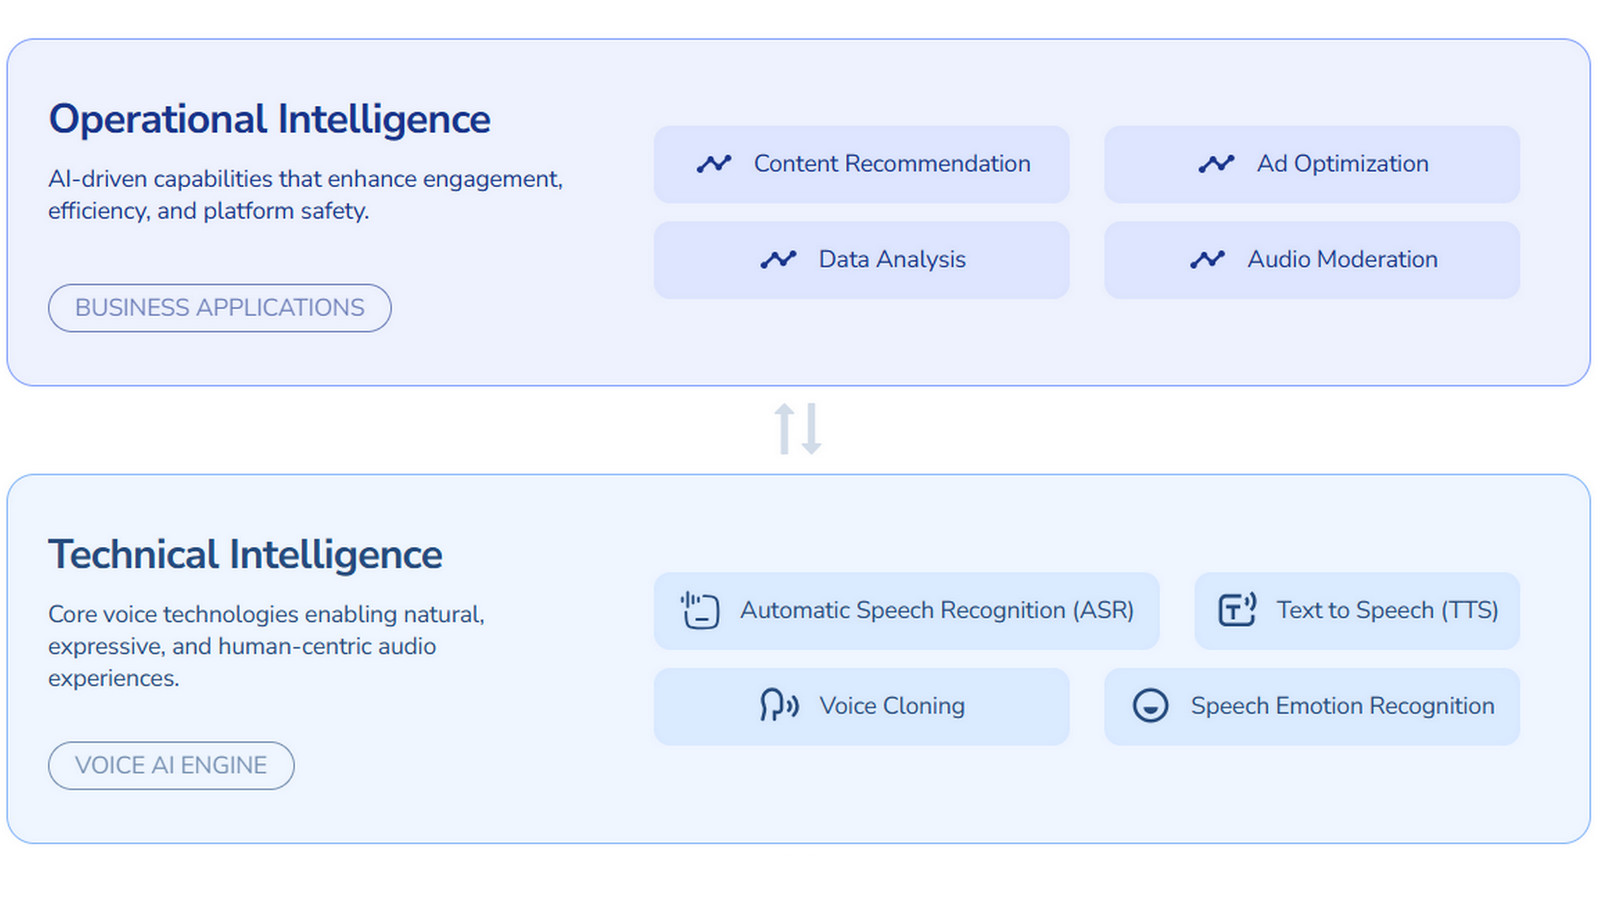
Manufactured products of Sound Group, Inc.

The growth dynamics of the Sound Group Inc. audio platform and the implementation of AIGC tools are clearly reflected in the price-to-sales ratio. This multiple determines the market value of one dollar of sales, allowing for an assessment of the business's investment attractiveness regardless of net profit. The calculation is based on dividing the market capitalization by the total annual revenue. For an investor, an increase in this coefficient during expansion into new regions signals a high premium for future revenue growth.

Competing companies

Market Cap to Sales Volume MSFT|Price-to-Revenue Ratio Alphabet GOOG|Price-to-Revenue Coefficient Amazon.com (AMZN)|META - Price-to-Revenue Ratio|Price to Sales Spotify AB|SE (Sea Limited) - Market Cap to Revenue|cloudflare.com (NET) - P/S Multiple|Price-to-Revenue Ratio Reddit|Market Cap to Revenue Ratio EBAY (eBay Inc)|P/S Multiple BIDU|VeriSign Corporation - Market Cap to Revenue Ratio|Pinterest, Inc. - Market Cap to Revenue|Market Capitalization-to-Revenue Ratio GDDY|Snap - P/S Multiple|Price-to-Revenue Multiple Akamai Technologies, Inc. (AKAM)|Tinder (MTCH) - Price-to-Revenue Ratio|StubHub Inc. - Market Capitalization-to-Revenue Ratio|Price-to-Revenue Ratio Etsy, Inc.|Price to Sales rumble.com RUM|Market Cap to Revenue GRND (Grindr)|P/S Multiple iac.com (IAC)|Price-to-Revenue Ratio Yelp.com YELP|WB (Weibo Inc.) - Price-to-Sales Ratio|PENG: Market Cap to Revenue|Market Capitalization-to-Revenue Ratio PLTK (playtika.com)|VMEO: P/S Multiple|MOMO - Price-to-Revenue Coefficient|Price-to-Revenue Ratio Fiverr Ltd.|Market Cap to Revenue Ratio GRPN (Groupon.com)|P/S Multiple NXDR|Market Cap to Revenue nerdwallet.com NRDS|NETGEAR - Market Cap to Revenue|Price-to-Revenue Coefficient Getty Images Holdings, Inc. (GETY)|ANGI - Price-to-Revenue Ratio|Price-to-Revenue Coefficient Bumble App BMBL|Xunlei Limited (XNET) - Price-to-Revenue Ratio|Price to Sales Sohu.com (SOHU)|TSSI (TSS) - P/S Multiple|ZH - Price-to-Revenue Multiple|Price-to-Revenue Ratio Triller Group Inc (ILLR)|BZUN: Price-to-Sales Ratio|ON24, Inc. - Market Cap to Revenue|Market Cap to Sales Volume DOYU (douyu.com)|AMTD Digital - P/S Multiple|Market Capitalization-to-Revenue Ratio GAIA (Gaia Inc.)|VSME: P/S Multiple|Price to Sales GD Culture Group Limited (GDC)|Market Cap to Revenue LVO|ZDGE: Market Capitalization-to-Revenue Ratio|P/S Multiple MYND|Price-to-Revenue Coefficient FiEE Inc.|Price-to-Revenue Ratio 36Kr Holdings Inc KRKR|FENG: Market Cap to Revenue Ratio|XHLD: Market Cap to Revenue|Fangdd Network Group - Market Cap to Sales Volume|NCPL: P/S Multiple|Price to Sales Hanryu Holdings, Inc. (GITS)|Price-to-Revenue Ratio DatChat|TNMG: Market Capitalization-to-Revenue Ratio|Price-to-Revenue Ratio Cheer Holding, Inc. (CHR)|ipdnusa.com - Market Cap to Revenue Ratio|P/S Multiple ONFO (Onfolio Holdings)|Pattern (PTRN) - Price to Sales|DATS: Market Cap to Revenue|Grom Social Enterprises - Market Cap to Sales Volume|hanryuholdings.com (HRYU) - Price-to-Revenue Ratio|LPTV - Price-to-Revenue Coefficient|Price-to-Revenue Ratio PropertyGuru|Price to Sales YY Inc. YY