AZZ - AZZ Inc. Price-to-Sales Ratio

Corporate company logo of AZZ Galvanizing (AZZ)

P/S volatility based on GURU.Markets chart data with a metric value of 2.30 confirms the dominance of AZZ Inc. (AZZ) in the North American hot-dip galvanizing segment. The business relies on plant expansion to monetize government contracts for the upgrading of power lines and bridges. Simultaneously, the company is implementing emission control systems and waste recycling to comply with environmental regulations.

AZZ: AZZ Galvanizing P/S Multiple 07/04/2022 - 11/13/2026
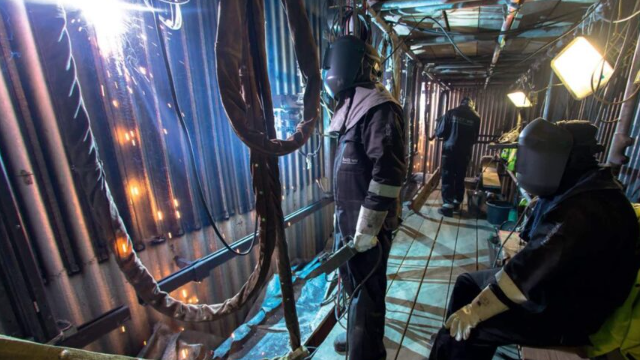
Manufactured products of AZZ Inc

The monopoly status of AZZ Inc. (AZZ) in the hot-dip galvanizing sector and stringent environmental barriers make the company's revenue a stable foundation of value. The price-to-sales ratio, reflected in the P/S time series, allows for an assessment of how much investors are willing to pay per unit of revenue, separating the actual scale of the business from a speculative bubble. Analysis of this chart helps identify abnormal asset overvaluation and determine the optimal entry point.

Competing companies

BHP: Price-to-Sales Ratio|Southern Copper Corporation - Market Cap to Revenue|RIO (Rio Tinto plc) - Price-to-Sales Ratio|FCX: Market Cap to Revenue|Market Capitalization-to-Revenue Ratio TECK (Teck Cominco)|PAAS: P/S Multiple|MP - Price-to-Revenue Coefficient|Price-to-Revenue Ratio ATI Inc|Market Cap to Revenue Ratio AA (Alcoa Corp)|P/S Multiple HBM|Market Cap to Revenue Buenaventura Corp BVN|Century Aluminum - Market Cap to Revenue|Price-to-Revenue Coefficient materion.com (MTRN)|The Metals Company - P/S Multiple|CSTM - P/S Multiple|SKE (Skeena Mining) - Market Cap to Revenue|Price-to-Sales Ratio ERO (Ero Copper Inc.)|Market Cap to Revenue KALU|ivanhoeelectric.com - Price-to-Sales Ratio|Price-to-Revenue Ratio Proto Labs (PRLB)|Market Cap to Revenue Taseko Mines Ltd TGB|P/S Multiple ALM (Almonty)|Solaris Resources Corp (SLSR) - Price to Sales|LAC: Market Cap to Revenue|usantimony.com - Market Cap to Sales Volume|NEXA: P/S Multiple|Sigma Lithium Corp (SGML) - P/S Multiple|Price-to-Revenue Ratio Standard Lithium Corp|Price-to-Revenue Ratio LAR|Market Cap to Revenue NAK (Northern Dynasty Minerals)|EMX (emxroyalty.com) - Market Capitalization-to-Revenue Ratio|P/S Multiple NB (NioCorp Developments)|NEWP - Market Cap to Revenue|LZM - Price-to-Revenue Ratio|Price to Sales NovaCopper|Western Copper and Gold (WRN) - Price-to-Revenue Ratio|IONR (ioneer.com) - Price-to-Revenue Ratio|Price-to-Revenue Ratio Namib Minerals Corp.|Price to Sales DMC Global, Inc. BOOM|Price-to-Revenue Ratio Comstock Inc. (LODE)|NEXM (nexmetalsmining.com) - Market Capitalization-to-Revenue Ratio|P/S Multiple ATLX (Atlas Lithium Corp)|P/S Multiple westwaterresources.net WWR|FMST: Market Cap to Revenue|Price-to-Sales Ratio LITM|ELBM (Electra Battery Materials Corp) - Market Cap to Revenue|Price-to-Sales Ratio BURU (Nuburu)|Market Cap to Revenue CHNR|AQMS: Market Capitalization-to-Revenue Ratio|P/S Multiple ELVR|Price-to-Revenue Coefficient americanlithiumcorp.com|Price-to-Revenue Ratio Haynes International, Inc. HAYN|LAAC: Market Cap to Revenue Ratio|Piedmont Lithium Inc. - P/S Multiple