SLI: Standard Lithium Corp P/S Multiple

Symbol and logo of brand Standard Lithium Corp (SLI)

Standard Lithium Ltd. is engaging external contractors for infrastructure construction to minimize technical risks. The price-to-sales ratio on this chart reflects the current business valuation, where the metric stands at . The company is implementing DLE technology in Arkansas to supply lithium to battery manufacturers. Financial results remain heavily dependent on metal price volatility and the growth rate of the electric vehicle market.

SLI (Standard Lithium Ltd) P/S Multiple history from 07/04/2022 to 11/13/2026

Metric breakdowns and analytics for Standard Lithium Corp (SLI)
General company analysis:standardlithium.com (SLI)
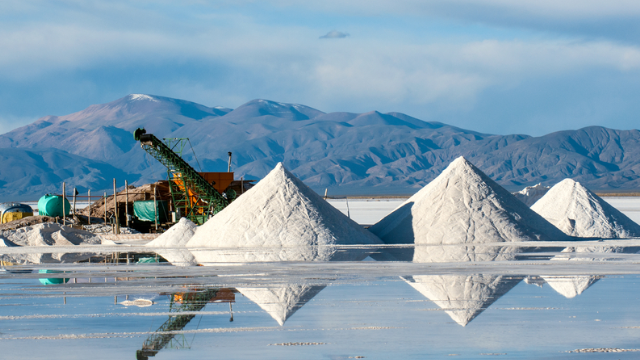
Signature product of Standard Lithium Mining

The P/S multiple compares market capitalization to annual sales volume, reacting promptly to price volatility and financial reports. This ratio determines the value of one dollar of revenue, signaling whether an asset is overvalued or presents an attractive investment opportunity. For Standard Lithium Ltd. (SLI), whose revenues remain hypothetical due to the complexity of launching DLE projects, the P/S multiple reflects the market's speculative expectations regarding future production.

Who Standard Lithium Ltd. competes with

Market Cap to Sales Volume BHP|P/S Multiple SCCO (Southern Copper Corporation)|P/S Multiple Rio Tinto plc RIO|FCX - Price-to-Revenue Ratio|TECK (Teck Cominco) - Market Cap to Revenue Ratio|PAAS: P/S Multiple|Market Cap to Revenue Ratio MP|ATI (ATI Inc) - P/S Multiple|P/S Multiple Alcoa Corp|Price-to-Revenue Ratio Hudbay (HBM)|BVN (Buenaventura Corp) - Market Capitalization-to-Revenue Ratio|P/S Multiple AZZ (AZZ Inc)|CENX: Market Cap to Revenue Ratio|MTRN: Market Cap to Revenue|Market Capitalization-to-Revenue Ratio TMC (TMC the metals company)|Constellium Corp (CSTM) - Price-to-Revenue Ratio|SKE (Skeena Corp) - Price-to-Revenue Ratio|ERO (Ero Copper Corp.) - P/S Multiple|kaiseraluminum.com (KALU) - Price-to-Revenue Coefficient|Market Cap to Revenue IE (Ivanhoe Electric)|Market Cap to Sales Volume PRLB|P/S Multiple TGB (Taseko)|Market Capitalization-to-Revenue Ratio ALM|Solaris Resources Inc. - P/S Multiple|Price-to-Revenue Coefficient lithiumamericas.com LAC|UAMY (United States Antimony Corporation) - Market Cap to Revenue|Nexa Resources SA (NEXA) - P/S Multiple|Price-to-Revenue Ratio Sigma Lithium Resources|Market Cap to Revenue Lithium Argentina Inc. (LAR)|Market Cap to Revenue NAK (Northern Dynasty Minerals)|EMX (emxroyalty.com) - Market Capitalization-to-Revenue Ratio|Price-to-Revenue Ratio NioCorp Developments NB|New Pacific Metals Corp - Price-to-Revenue Ratio|LZM: Market Cap to Revenue|NovaCopper - Market Cap to Sales Volume|WRN: P/S Multiple|Market Cap to Revenue Ratio IONR|Market Cap to Revenue NAMM|DMC Global, Inc. (BOOM) - Price-to-Revenue Coefficient|Price-to-Revenue Ratio Comstock Inc. (LODE)|Price-to-Revenue Coefficient nexmetalsmining.com|Price-to-Revenue Ratio Atlas Lithium Corp ATLX|westwaterresources.net - Price-to-Revenue Ratio|Foremost Lithium Ltd - P/S Multiple|Price-to-Revenue Coefficient Snow Lake Resources LITM|Electra Battery Materials Corp (ELBM) - Price-to-Revenue Ratio|Market Cap to Revenue Nuburu|CHNR (China Natural Resources, Inc.) - P/S Multiple|Price to Sales Aqua Metals Inc. AQMS|Market Cap to Revenue ELVR (Sayona Mining)|Market Cap to Sales Volume AMLI|P/S Multiple HAYN (Haynes International, Inc.)|P/S Multiple Lithium Argentina LAAC|PLL - Price-to-Revenue Ratio