ioneer Limited (IONR): Price to Sales

Symbol and logo of brand ioneer Limited (IONR)

ioneer Ltd ADR is developing lithium assets in the US, leveraging stable demand from the electric vehicle sector and localized supply chains. The price-to-sales ratio dynamics visualize the link between market value and revenue, while the metric indicates the status of the current valuation. High dependence on external construction contractors during mine development necessitates strict internal operational control.

IONR (ioneer Limited) P/S Multiple history from 07/04/2022 to 11/16/2026

Metric breakdowns and analytics for ioneer Ltd ADR (IONR)
- price and consensus price forecast:
- stock exchange capitalization data:
Summary company analytics:ioneer Ltd, IONR
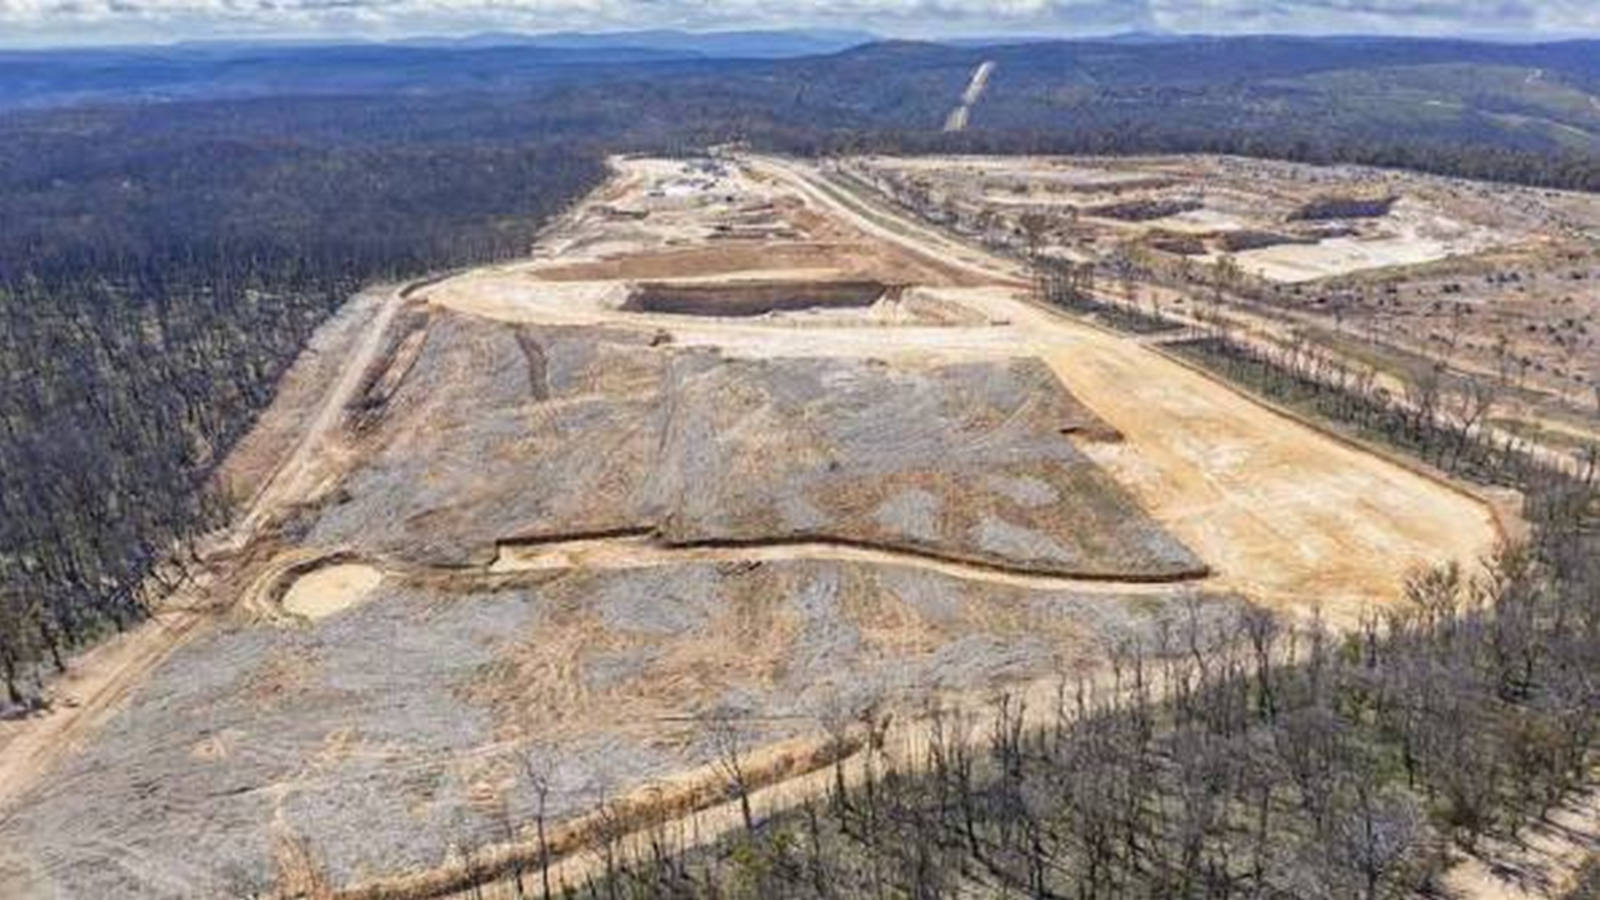
Mass-produced product of ioneer Corp

The P/S ratio reflects market capitalization per unit of revenue, allowing for an assessment of business value relative to actual cash inflows. By analyzing the historical P/S value of ioneer Ltd ADR (IONR), an investor can observe the market's reaction to reported revenue, which is critical for ioneer Ltd ADR (IONR) in the context of scaling lithium and boron production for the electric vehicle sector.

Competitors of ioneer Ltd ADR

BHP (BHP Billiton) - Market Capitalization-to-Revenue Ratio|Price-to-Revenue Ratio southerncoppercorp.com SCCO|Rio Tinto Group (RIO) - Price to Sales|Freeport - P/S Multiple|teck.com (TECK) - Market Cap to Revenue|PAAS (Pan American Silver Corp.) - Market Cap to Revenue|MP: Market Cap to Sales Volume|Price-to-Revenue Ratio Allegheny Technologies|Market Cap to Revenue Alcoa Corp. (AA)|Market Cap to Revenue HBM (Hudbay Minerals Inc.)|BVN - Price to Sales|azargauranium.com - Market Cap to Revenue|Century Aluminum Co. (CENX) - Price to Sales|MTRN - Price-to-Revenue Ratio|TMC the metals company Inc. (TMC) - Market Cap to Revenue|CSTM: P/S Multiple|SKE - Price-to-Revenue Coefficient|Market Cap to Revenue ERO|P/S Multiple Kaiser Aluminum Corp|Market Cap to Revenue IE (Ivanhoe Electric)|PRLB (Proto Labs Inc) - Market Capitalization-to-Revenue Ratio|Taseko Mines Limited - Market Cap to Revenue|Price-to-Revenue Coefficient Almonty Industries (ALM)|SLSR: Market Cap to Revenue|Lithium Americas (LAC) - Market Cap to Revenue|UAMY (US Antimony Corp) - Market Cap to Revenue|NEXA - Price-to-Revenue Coefficient|SGML (Sigma Lithium Inc.) - P/S Multiple|Market Cap to Revenue Standard Lithium (SLI)|P/S Multiple LAR|NAK (Northern Dynasty Minerals Ltd) - Market Capitalization-to-Revenue Ratio|Price-to-Revenue Ratio Eurasian Minerals EMX|Market Cap to Sales Volume NB (NioCorp Corp)|NEWP - Price-to-Revenue Ratio|Lifezone Metals Limited (LZM) - Market Cap to Revenue|TMQ (Trilogy Metals Inc.) - Market Cap to Revenue|Price-to-Revenue Multiple Western Copper & Gold WRN|NAMM (namibminerals.com) - P/S Multiple|Market Cap to Revenue DMC Global Inc (BOOM)|P/S Multiple LODE|NEXM: Price-to-Sales Ratio|Price-to-Revenue Ratio Atlas Lithium Corp. ATLX|WWR - Market Cap to Revenue|FMST: Market Cap to Revenue|Snow Lake Resources Ltd. (LITM) - Market Cap to Revenue|Electra Battery Materials (ELBM) - Price-to-Revenue Ratio|BURU (NUBURU) - Price-to-Revenue Ratio|CHNR (China Natural Resources, Inc.) - P/S Multiple|Price-to-Revenue Ratio AQMS|Price-to-Revenue Ratio Sayona Mining Corp (ELVR)|Price-to-Revenue Coefficient American Lithium Corp|Haynes International, Inc. - Market Cap to Revenue|LAAC - Market Cap to Revenue|PLL - Price-to-Revenue Ratio