Fresenius Medical Care AG - FMS Total Company Value-to-Revenue Ratio

Official company branding of Fresenius Medical Care AG & Co. KGaA (FMS)

The investment potential of Fresenius Medical Care (FMS) is limited by a rigid duopoly and the risk of innovative drugs emerging. The shift in the EV/Sales multiple demonstrates market expectations, where 1001.44 reflects the baseline level of the metric. Business resilience is guaranteed by a lack of seasonality and independence from economic cycles. Global dominance in the production of consumables and strict medical regulations provide Fresenius Medical Care (FMS) with robust protection of its market share.

FMS Fresenius Medical Care Enterprise Value-to-Revenue Ratio (11/23/2025 - 11/20/2026)

FMS (Fresenius Medical): analytical breakdowns and indicator data
- share price and consensus valuation forecast:
Fundamental company valuation:FMS, Fresenius Medical Care
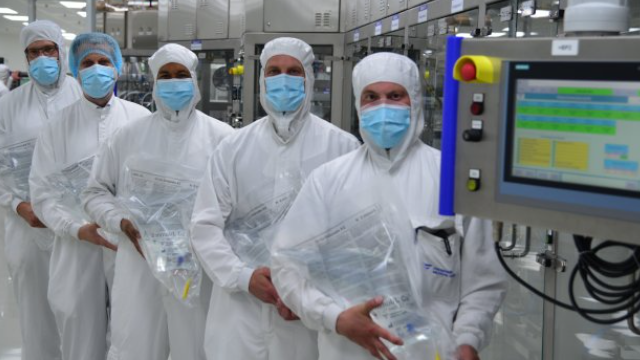
Product sample of Fresenius Medical Care Corp

This indicator determines the total business value relative to annual sales volume, excluding the impact of debt load to provide an objective assessment of fundamental attractiveness. An increase in this ratio signals the market's willingness to pay a premium for future earnings, which necessitates caution when entering the asset. By analyzing the EV/Sales multiple on GURU.Markets, an investor can see how the implementation of water-saving technologies in hemodialysis at Fresenius Medical Care (FMS) affects the company's market value.

Competitor analysis for Fresenius Medical Care

Enterprise Value-to-Revenue Multiple hcahealthcare.com|THC: EV/Sales Multiple|Company Value to Revenue Ratio SOLV|Enterprise Value-to-Revenue Ratio Encompass|EV/Sales Multiple uhsinc.com|Enterprise Value-to-Revenue Ratio DaVita (DVA)|Total Company Value-to-Revenue Ratio radnet.com|EV/Sales Multiple OPCH (optioncarehealth.com)|SGRY (Surgery Partners) - Enterprise Value to Sales Volume|PINC - Enterprise Value-to-Revenue Ratio|Total Company Value-to-Revenue Ratio America's Best Contacts & Eyeglasses EYE|PGNY: EV/Sales Multiple|ARDT (Ardent Health Partners) - Enterprise Value-to-Revenue Ratio|SEM (selectmedical.com) - EV/Sales Multiple|Enterprise Value-to-Revenue Ratio ASTH|EV/Sales Multiple MD|Enterprise Value-to-Revenue Ratio USPH (US Physical Therapy Inc)|Enterprise Value-to-Revenue Ratio The Pennant Group, Inc. PNTG|Business Value to Revenue ORGO|NUTX - Enterprise Value-to-Revenue Ratio|AUNA - EV/Sales Multiple|SBC Medical Group Inc (SBC) - Enterprise Value-to-Revenue Ratio|EOLS: Enterprise Value-to-Revenue Coefficient|Enterprise Value-to-Revenue Ratio chs.net|SKIN: Business Value to Revenue|EV/Sales Multiple MDWD|BTMD - Enterprise Value-to-Revenue Multiple|The Joint Chiropractic - Company Value to Revenue|Enterprise Value-to-Revenue Coefficient DCGO (DocGo, Inc)|Total Company Value-to-Revenue Ratio PIII (p3hp.org)|GANX (Gain Therapeutics) - Company Value to Revenue Ratio|euda.com (EUDA) - Enterprise Value-to-Revenue Ratio|Company Value to Revenue Basel Medical|CLGN (CollPlant Biotechnologies) - EV/Sales Multiple|EV/Sales Multiple Cuprina Holdings Limited|Enterprise Value-to-Revenue Ratio concordmedical.com (CCM)|Enterprise Value-to-Revenue Ratio AMS (American Shared Hospital)|Enterprise Value-to-Revenue Ratio MEDIROM Corp MRM|EV/Sales Multiple avalon-globocare.com ALBT|DHAI - Enterprise Value-to-Revenue Ratio|Total Company Value-to-Revenue Ratio Longevity Health Holdings XAGE|NIVF (NewGenIvf Group Limited) - Company Value to Revenue|ATI Physical Therapy Inc. - Business Value to Revenue|CMAX (caremax.com) - EV/Sales Multiple|KDLY (Kindly MD Inc) - Enterprise Value-to-Revenue Coefficient|Enterprise Value-to-Revenue Ratio ModivCare Corp (MODV)|Total Company Value-to-Revenue Ratio Novo Integrated Sciences|SunLink Health Systems, Inc. - Company Value to Revenue|imacholdings.comm (BACK) - Enterprise Value-to-Revenue Multiple