Return on Sales by Net Profit: Fresenius Medical Care AG & Co. KGaA (FMS)

Brandmark of Fresenius Medical Care Corp (FMS)

Fresenius Medical Care generates revenue from life-sustaining procedures for patients with kidney failure, which guarantees a stable cash flow. Average sales margins reflect profitability dynamics within the US cycle, with the parameter stabilizing at 4.20. High barriers to entry protect the business from new players, although labor shortages and rising wages are currently hindering operational growth.

freseniusmedicalcare.com (FMS) Company Sales Margin: for the period 07/04/2022 - 11/19/2026

Analytical breakdowns and data insights for company Fresenius Medical Care Corp (FMS)
- company stock exchange capitalization indicators:
Comprehensive company analysis:Fresenius Medical Care Corp - FMS
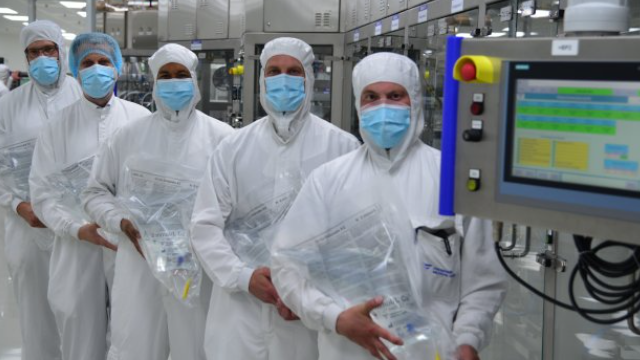
Manufactured product of Fresenius Medical Care AG

Strategic alliances between Fresenius Medical Care (FMS) and public hospitals to establish dialysis centers directly impact cost efficiency, which is reflected in the trend of adjusted net sales margin. This indicator measures the profit share of every dollar of revenue, determining the business's resilience to shocks and the company's ability to service its debt, where any decline in the ratio signals a risk of operational degradation.

Key competitors

HCA: Net Sales Margin|Tenet Healthcare Corporation - Net Profit Rate|Return on Sales by Net Profit SOLV|Encompass (EHC) - Company Sales Margin|Net Margin Universal Health Services, Inc. (UHS)|DaVita Inc. - Net Return on Sales|Net Margin RadNet Corp RDNT|Net Sales Margin Option Care OPCH|Surgery Partners Inc - Net Sales Margin|PINC (Premier Corp) - Net Return on Sales|nationalvision.com (EYE) - Net Margin|Return on Sales by Net Profit Progyny|Return on Sales by Net Profit ARDT|Net Sales Margin Select Medical Corporation|Return on Sales by Net Profit ASTH (Astrana Health)|Return on Sales by Net Profit Pediatrix MD|U.S. Physical Therapy - Return on Sales by Net Profit|Net Profit Rate PNTG|Organogenesis - Net Sales Margin|NUTX (Nutex Health) - Net Return on Sales|AUNA (Auna) - Return on Sales by Net Profit|Net Profit Margin SBC (SBC Medical Group Holdings)|Net Margin Evolus, Inc.|Community Health Systems, Inc. (CYH) - Company Sales Margin|Net Margin Beauty Health (SKIN)|MediWound, Ltd. - Net Return on Sales|Net Sales Margin BTMD (Biote)|Company Net Profitability JYNT (The Joint Corp.)|DCGO - Net Margin|PIII: Net Margin|GANX: Net Sales Margin|Return on Sales by Net Profit EUDA Health|BMGL (Basel Medical Group) - Net Sales Margin|CLGN - Net Profitability Margin|Net Margin Cuprina Holdings (CUPR)|Company Sales Margin Concord Medical Services|Net Sales Margin AMS (ashs.com)|MEDIROM Healthcare Group Inc. (MRM) - Net Margin|ALBT: Return on Sales by Net Profit|Net Profit Rate DHAI (DIH Holding US Inc.)|XAGE (Carmell Therapeutics) - Return on Sales by Net Profit|NIVF (NewGenIvf Group Limited) - Net Margin|ATIP (ATI Physical Therapy Inc.) - Net Sales Margin|Net Sales Margin CareMax Inc.|Net Margin Kindly MD Inc (KDLY)|Return on Sales by Net Profit ModivCare Corp MODV|Novo Integrated - Return on Sales by Net Profit|Company Net Profitability SSY (SunLink Health Systems)|BACK - Net Margin