General Mills Inc (GIS): Net earnings per share (EPS TTM)
Official company branding of General Mills Inc (GIS)

General Mills, Inc. (GIS) stability relies on controlling agricultural raw material costs and maintaining market positions during an era of inflation. The rolling annual earnings per share helps track income dynamics, while -1.68 indicates the current level. Business scalability is based on global logistics and mass production, although risks from new obesity drugs and rising shipping costs exert pressure.

GIS (General Mills Company) Net earnings per one share for the last twelve months history from 07/04/2022 to 11/15/2026

Analytical breakdowns for General Mills Corp (GIS)
- current quotes and average value forecast:
Summary company analysis:GIS - General Mills Company
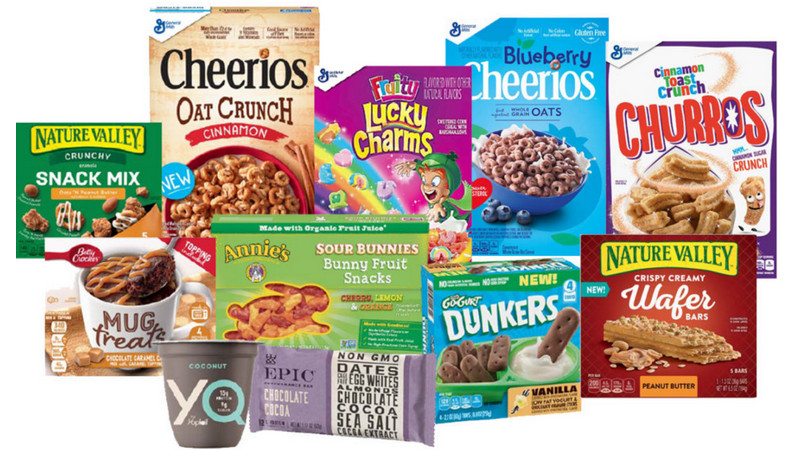
Flagship merchandise of General Mills Inc

General Mills, Inc. (GIS) leverages a stable workforce and e-commerce expertise to directly drive growth in earnings per share. By analyzing trailing twelve-month (TTM) net income per share, investors can assess the business's actual unit profitability, stripped of issuance factors. This chart captures the trend necessary to identify fundamental undervaluation of the asset in a timely manner, while accounting for the company's debt load.

Main competitors

KHC - Earnings per share for the last twelve months|Net earnings per one share for the last twelve months Kellogg's|MKC: Net earnings per share (EPS TTM)|JBS USA - Earnings per share for the trailing year|HRL (Hormel) - Net earnings per share (EPS TTM)|Net earnings per one share for the last twelve months The J. M. Smucker Company SJM|Net earnings per share (EPS TTM) PPC|Campbell Soup Co. - Earnings per share for the last 12 months|Smithfield Foods, Inc. - Net earnings per share for the last 12 months|INGR: Earnings per share for the last 12 months|LW - Earnings per share for the last twelve months|Earnings per share for the trailing year BRFS (BRF S.A.)|POST: Net earnings per share (EPS TTM)|Earnings per one share for the last 12 months MZTI (The Marzetti Company)|Earnings per share for the last twelve months bellring.com|Earnings per share for the last 12 months TR (Tootsie Roll Industries)|Net earnings per share (EPS TTM) FLO|SMPL - Net earnings per one share for the last twelve months|Net earnings per share (EPS TTM) NOMD (Nomad Foods Corp)|KLG - Net earnings per share for the last 12 months|JJSF - Earnings per share for the last twelve months|Utz Brands, Inc. - Earnings per share for the last four quarters|THS: Net earnings per share (EPS TTM)|sunopta.com (STKL) - Net earnings per share (EPS TTM)|JBSS (jbssinc.com) - Net earnings per share (EPS TTM)|Net earnings per one share for the last twelve months Seneca Foods Corp SENEA|Net earnings per share (EPS TTM) LWAY|Net earnings per share (EPS TTM) Mama's Creations Corp (MAMA)|Earnings per share for the last twelve months B&G Foods Inc BGS|BYND: Earnings per share for the last 12 months|hain.com - Net earnings per share (EPS TTM)|Earnings per one share for the last 12 months BRID|WYHG: Net earnings per share (EPS TTM)|Laird Superfood Inc. (LSF) - Net earnings per share (EPS TTM)|Earnings per share for the last twelve months Borealis Foods, Inc.|Earnings per share for the last twelve months FARM|Net earnings per share for the last 12 months BOF (BranchOut Food, Inc.)|PFAI (Pinnacle Food Group Inc.) - Earnings per share for the trailing year|Net earnings per share (EPS TTM) SOWG (thisissowgood.com)|Earnings per share for the trailing year TWG|STKH - Earnings per share for the last twelve months|Earnings per one share for the last 12 months BSFC|FREE (Whole Earth) - Net earnings per share for the last 12 months|Net earnings per one share for the last twelve months Lancaster Colony Corp (LANC)|Net earnings per share for the last 12 months RGF|SNAX: Earnings per share for the trailing year|Net earnings per share (EPS TTM) SOVO