General Mills Inc (GIS) - Forward P/S Multiple
generalmills.com (GIS) - corporate logo

The forward P/S indicator illustrates the valuation dynamics of General Mills, Inc. (GIS), where the value 1.00 represents the current metric. General Mills, Inc. (GIS) is transforming its portfolio by developing natural snack and premium pet food segments. Scaling growth is constrained by physical logistics but supported by marketing. High barriers to entry create resilience through shelf-space dominance and favorable raw material procurement.

GIS General Mills: Market Cap to Future Revenue Ratio in the range 07/04/2022 - 11/14/2026

General Mills Company - analytical breakdowns and key metrics (GIS)
- stock price and consensus target price:
Basic company analysis:General Mills GIS
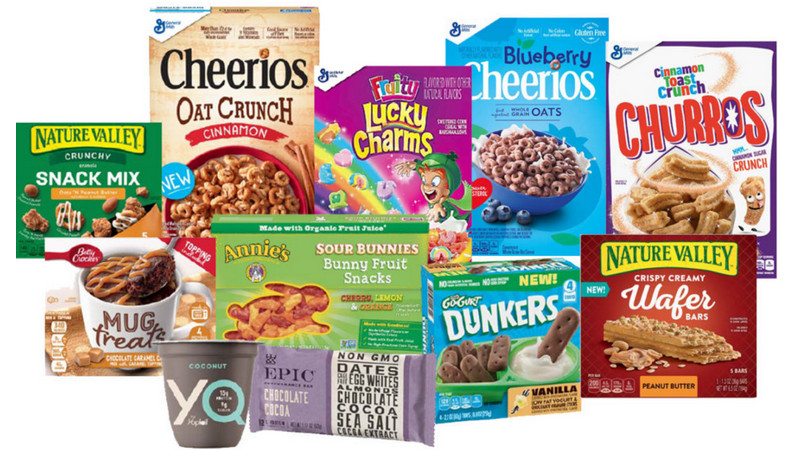
Product sample of General Mills Company

The diversified brand portfolio of General Mills, Inc. (GIS), including the premium pet food segment, allows for the assessment of the business's market value via forward P/S based on forecasts. This metric is calculated as the ratio of current market capitalization to expected revenue, determining the premium paid for future sales. Analyzing this indicator helps investors balance volatility risk against the fundamental stability of General Mills, Inc. (GIS) within the food sector.

Competitor analysis

Kraft Heinz - Forward Price-to-Revenue Multiple|Forward Price to Sales K|McCormick & Co. - Forward P/S Multiple|Future Price to Revenue JBS|Hormel Foods Corporation (HRL) - Price-to-Projected Revenue Ratio|Market Cap to Future Revenue Ratio jmsmucker.com (SJM)|Price-to-Projected Revenue Ratio Pilgrim's Pride Corporation|Market Cap to Future Revenue Ratio Campbell Soup CPB|Forward P/S Multiple SFD|Corn Products International - Market Cap to Projected Revenue|Forward P/S Multiple LW (Lamb Weston Holdings)|Projected Price to Revenue brf-global.com|Post Holdings - Forward P/S Multiple|Market Cap to Future Revenue Ratio The Marzetti Company|BellRing Brands Inc (BRBR) - Price-to-Projected Revenue Ratio|Market Cap to Projected Revenue TR|FLO (Flowers Foods, Inc.) - Forward P/S Multiple|Market Cap to Future Revenue Ratio The Simply Good Foods SMPL|Price-to-Projected Revenue Ratio Nomad Foods (NOMD)|KLG (WK Kellogg Corporation) - Forward Price to Sales|Forward P/S Multiple JJSF (J&J Snack Foods Corp.)|Forward P/S Multiple Utz Brands Corp UTZ|THS - Price-to-Projected Revenue Ratio|STKL: Price-to-Projected Revenue Ratio|JBSS (jbssinc.com) - Forward Price-to-Revenue Multiple|Seneca Foods Corp - Forward Price to Sales|Price-to-Projected Revenue Ratio Lifeway Kefir|Forward Price-to-Revenue Multiple Mama's Creations Corp (MAMA)|Forward P/S Multiple BGS|Market Cap to Expected Sales Ratio beyondmeat.com|Price-to-Projected Revenue Ratio The Hain Celestial Group HAIN|Bridgford Foods Corp. - Price-to-Projected Revenue Ratio|WYHG - Price-to-Projected Revenue Ratio|LSF: Price-to-Projected Revenue Ratio|Borealis Foods (BRLS) - Price-to-Projected Revenue Ratio|FARM - Market Cap to Expected Sales Ratio|Forward Price-to-Revenue Multiple BOF|PFAI: Forward Price to Sales|Forward P/S Multiple SOWG|Market Cap to Expected Sales Ratio Top Wealth Group Ltd|Price-to-Projected Revenue Ratio Steakholder Foods Ltd. STKH|BSFC: Market Cap to Projected Revenue|Whole Earth - Forward P/S Multiple|Lancaster Colony Corp (LANC) - Forward Price-to-Revenue Multiple|RGF (The Real Good Food Company Inc.) - Forward Price-to-Revenue Multiple|SNAX - Market Cap to Expected Sales Ratio|SOVO (Sovos Brands, Inc.) - Forward P/S Multiple