GIS - General Mills Inc Market Capitalization-to-Revenue Ratio
Corporate company logo of General Mills Inc (GIS)

The optimization of regional hubs to hedge against transport disruptions supports stability, and this estimated P/S shown in GURU.Markets visualizes this resilience. The current level of 1.00 captures fresh values, while conservative demand for classic blends ensures capital inflow. However, rising raw material prices and pressure from budget brands are constraining the expansion of General Mills, Inc. (GIS).

General Mills Corp (GIS) - Price-to-Revenue Ratio from 07/04/2022 to 11/13/2026

Analytical breakdowns for General Mills Corp (GIS)
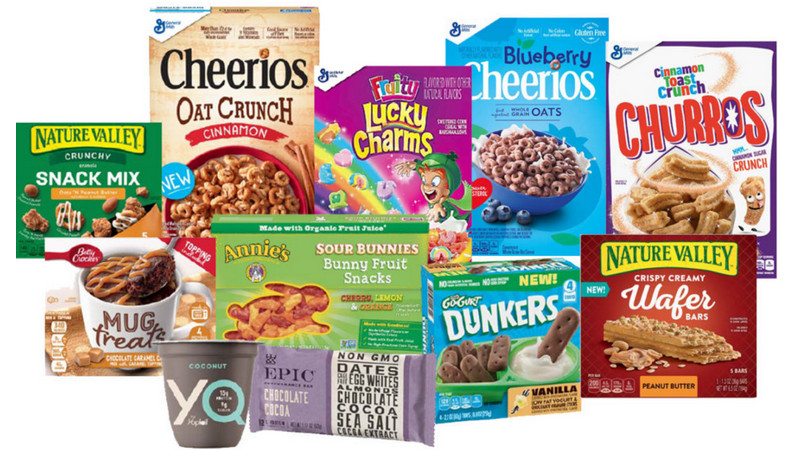
- stock price and consensus target price:
- market capitalization statistics:
General company analysis:General Mills, Inc.
Mass-produced product of generalmills.com

The P/S ratio compares market capitalization to annual sales volume, allowing for a real-time assessment of business valuation changes prior to the publication of financial reports. By analyzing the historical P/S value of General Mills, Inc. (GIS), an investor can see how the resilience of General Mills, Inc. (GIS) brands against the expansion of discount retailers supports the stock price relative to revenue, helping to determine a fair entry point and avoid overpaying for the asset.

Competing companies

kraftheinzcompany.com - Market Cap to Revenue Ratio|Kellogg's - Market Cap to Revenue|Market Capitalization-to-Revenue Ratio MKC|JBS Group - P/S Multiple|Price-to-Sales Ratio HRL|The J. M. Smucker Company (SJM) - Price-to-Revenue Ratio|Price to Sales pilgrims.com (PPC)|Price-to-Revenue Ratio Campbell's|Price to Sales Smithfield SFD|P/S Multiple INGR|Lamb Weston Inc. - Market Cap to Revenue Ratio|P/S Multiple BRFS (BRF S.A.)|Price-to-Revenue Multiple postholdings.com|T. Marzetti - P/S Multiple|Price to Sales Premier Protein|Tootsie Roll Industries Inc (TR) - Price-to-Revenue Ratio|Market Cap to Revenue Ratio FLO|SMPL (Quest Nutrition) - P/S Multiple|Price to Sales nomadfoods.com NOMD|Price-to-Revenue Ratio WK Kellogg (KLG)|JJSF (J&J Snack Foods Corp) - Market Capitalization-to-Revenue Ratio|P/S Multiple UTZ (Utz Quality Foods)|P/S Multiple TreeHouse Foods Inc. THS|STKL - Price-to-Revenue Ratio|JBSS: Price-to-Revenue Ratio|SENEA (Seneca Foods Corporation) - Market Cap to Revenue|Lifeway Foods Inc - Market Capitalization-to-Revenue Ratio|Price-to-Revenue Ratio MamaMancini's|Market Cap to Revenue B&G Foods Holding (BGS)|P/S Multiple BYND|Price-to-Revenue Coefficient hain.com|Price-to-Revenue Ratio Bridgford Foods Corporation BRID|Wing Yip Food Holdings Group - Price-to-Revenue Ratio|LSF - Price-to-Revenue Ratio|BRLS: Price-to-Revenue Ratio|farmerbros.com (FARM) - Price-to-Revenue Ratio|BOF - Price-to-Revenue Coefficient|Market Cap to Revenue PFAI|SOWG: Market Capitalization-to-Revenue Ratio|P/S Multiple TWG|Price-to-Revenue Coefficient Steakholder Foods Corp|Price-to-Revenue Ratio Blue Star Foods Corp. BSFC|FREE: Market Cap to Revenue Ratio|Lancaster Colony Corporation - P/S Multiple|Real Good Food (RGF) - Market Cap to Revenue|SNAX (Stryve) - Market Cap to Revenue|SOVO - Price-to-Revenue Coefficient