GIS: General Mills, Inc. Growth-Adjusted Market Cap to Net Income

Symbol and logo of brand General Mills Company (GIS)

The peg_co metric helps assess the growth valuation of General Mills, Inc. (GIS), leveraging its powerful brand ecosystem and retail dominance. Revenues are driven by mass-market demand in North America, including the yogurt and pet food segments. Automated plants with scheduled capacity utilization ensure stability. The current value has settled at 0.00, which allows for the determination of the business's actual valuation trajectory.

General Mills Inc (GIS): PEG Multiple from 07/04/2022 to 11/12/2026
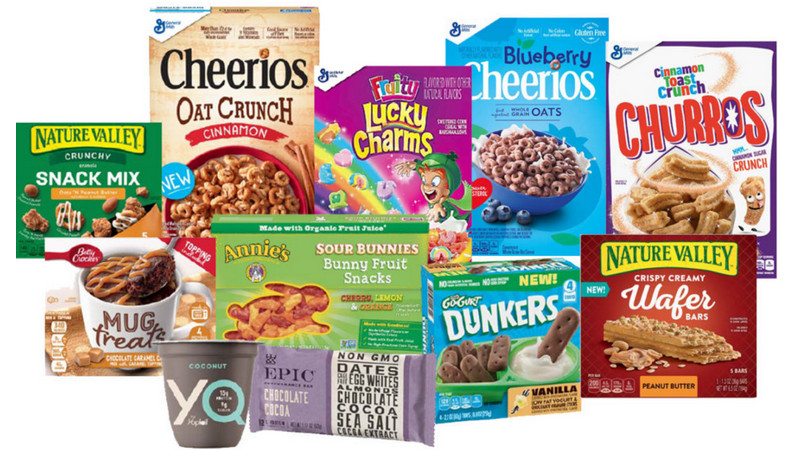
Mass-produced product of General Mills Inc

General Mills, Inc. (GIS) is optimizing costs through packaging robotization and the integration of AI into logistics, reducing its reliance on manual labor. By analyzing the PEG ratio, an investor compares the asset's market value with its earnings growth: values below one signal that the company is undervalued relative to its growth rates, confirming the fundamental stability of the current entry price.

Competing companies

Kraft Heinz Company - Growth-Adjusted P/E Ratio|PEG Multiple K (Kellanova Company)|Growth-Adjusted Market Cap to Net Income McCormick & Co., Inc. (MKC)|JBS - Price/Earnings to Growth Ratio|Growth-Adjusted Market Cap to Net Income hormelfoods.com HRL|SJM: PEG Multiple|Pilgrim's - Growth-Adjusted Payback Ratio|CPB (Campbell Soup Co.) - PEG Multiple|Price to Earnings Adjusted for Growth Rate Smithfield Foods Corp SFD|PEG Multiple INGR|Lamb Weston Holdings, Inc. - Growth-Adjusted P/E Ratio|BRF - Price/Earnings to Growth Multiple|Growth-Adjusted Payback Ratio POST|T. Marzetti Company - PEG Multiple|Market Cap to Earnings and Growth Ratio BRBR|Tootsie Roll Industries (TR) - Price/Earnings to Growth Ratio|Price to Earnings Adjusted for Growth Rate flowersfoods.com (FLO)|Price/Earnings to Growth Ratio The Simply Good Foods Company|Price to Earnings Adjusted for Growth Rate Nomad Foods Ltd NOMD|PEG Multiple KLG|J&J Snack Foods Inc - Growth-Adjusted P/E Ratio|PEG Multiple UTZ (Utz Brands, Inc.)|Price to Net Income Growth Ratio treehousefoods.com|SunOpta - PEG Multiple|Price to Earnings Adjusted for Growth Rate John B. Sanfilippo & Son|Seneca Foods Corp. (SENEA) - Price/Earnings to Growth Ratio|Growth-Adjusted P/E Ratio LWAY|MAMA (Mama's Creations, Inc.) - PEG Multiple|Price to Earnings Adjusted for Growth Rate bgfoods.com BGS|Price/Earnings to Growth Ratio Beyond Meat, Inc. (BYND)|HAIN (The Hain Celestial Group, Inc.) - Growth-Adjusted Payback Ratio|PEG Multiple BRID (Bridgford Foods Corp)|PEG Multiple Wing Yip Food Holdings Group WYHG|LSF - Price/Earnings to Growth Ratio|BRLS: Price/Earnings to Growth Ratio|FARM (farmerbros.com) - Price/Earnings to Growth Multiple|BranchOut Food - Growth-Adjusted Payback Ratio|Price/Earnings to Growth Ratio Pinnacle Food Group Inc|Price/Earnings to Growth Multiple Sow Good, Inc. (SOWG)|PEG Multiple TWG|Growth-Adjusted Market Cap to Net Income steakholderfoods.com|Price/Earnings to Growth Ratio Blue Star Foods Corp. BSFC|Whole Earth Brands Inc. - Price/Earnings to Growth Ratio|LANC - Price/Earnings to Growth Ratio|RGF: Price/Earnings to Growth Ratio|Stryve Foods, Inc. (SNAX) - Price/Earnings to Growth Ratio|SOVO - Growth-Adjusted Market Cap to Net Income