Seneca Foods (SENEA) Cash on Hand per Share
High barriers to entry and strict FDA oversight determine the change in cash per share within the indicator's chronology on the GURU.Markets chart, where 0.31 represents the latest metric reading. Seneca Foods revenues are based on wholesale canned food supplies to retail and restaurants. Leading positions in the vegetable segment and economies of scale provide the company with sustainable margins.

Comprehensive metric breakdowns and analytics for Seneca Foods Company (SENEA)
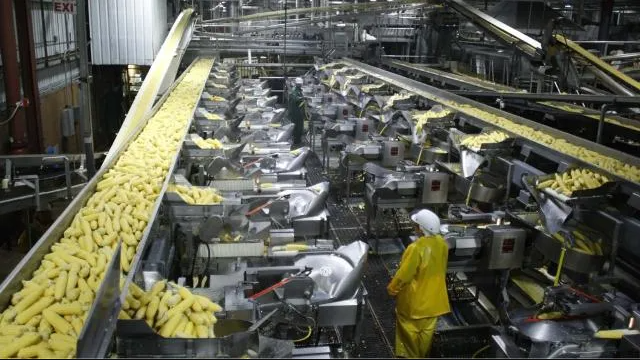
Seneca Foods' diversified canning portfolio and balanced distribution channels ensure a steady flow of liquidity, which is reflected in the cash per share structure. This indicator is calculated by dividing total cash holdings by the number of shares outstanding, allowing for an assessment of the actual defensive capital per share and determining the balance between minimizing default risks and resource efficiency.
