SENEA: Seneca Foods Corp Price to Sales
Symbol and logo of brand Seneca Foods Corp. (SENEA)

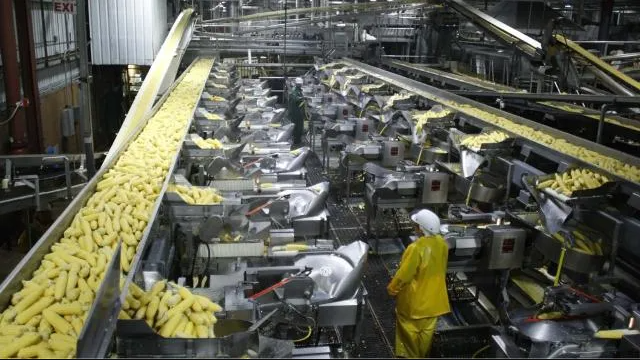
Seneca Foods strictly adheres to EPA environmental standards for wastewater treatment and packaging recycling. The price-to-sales ratio on the GURU.Markets chart clearly confirms this stability, where the 0.50 level indicates the parameter's status. Business efficiency relies on the massive volumes of automated canning, while a diversified supply portfolio mitigates climate risks and raw material price volatility.

SENEA (senecafoods.com) Market Cap to Revenue history from 07/04/2022 to 11/13/2026

Metric breakdowns and analytics for Seneca Foods Corp. (SENEA)
- market capitalization information:
Fundamental company analysis:SENEA - senecafoods.com
Flagship merchandise of Seneca Foods Corporation

Seneca Foods (SENEA) dominates the canning sector by scaling its Private Label and controlling raw material volumes. The price-to-sales ratio trend reflects the market valuation of every dollar of revenue, allowing investors to filter out volatility and determine whether they are overpaying for the stability of the business model or if the asset is undervalued relative to its operating turnover.

Competing companies

KHC (kraftheinzcompany.com) - Market Capitalization-to-Revenue Ratio|P/S Multiple K (Kellogg's)|General Mills Inc (GIS) - Price to Sales|McCormick & Co. - P/S Multiple|JBS (JBS N.V.) - Market Cap to Revenue Ratio|HRL (Hormel Foods Corporation) - Market Cap to Revenue|jmsmucker.com - Market Capitalization-to-Revenue Ratio|PPC (Pilgrim's Pride Corporation) - P/S Multiple|Campbell Soup - Price-to-Sales Ratio|Price-to-Revenue Ratio Smithfield Foods, Inc. (SFD)|INGR - Price to Sales|Price-to-Revenue Ratio Lamb Weston Holdings LW|brf-global.com (BRFS) - Price to Sales|Post Holdings - P/S Multiple|MZTI (The Marzetti Company) - Market Cap to Revenue Ratio|BellRing Brands Inc (BRBR) - Price-to-Revenue Ratio|TR - Price-to-Revenue Coefficient|FLO (Flowers Foods, Inc.) - P/S Multiple|Price to Sales The Simply Good Foods SMPL|Price-to-Revenue Ratio Nomad Foods (NOMD)|WK Kellogg Corporation - Market Cap to Revenue Ratio|P/S Multiple JJSF (J&J Snack Foods Corp.)|Utz Brands Corp (UTZ) - Price to Sales|TreeHouse Foods, Inc. - P/S Multiple|sunopta.com (STKL) - Market Cap to Revenue|JBSS: P/S Multiple|Lifeway Foods Inc (LWAY) - P/S Multiple|Market Cap to Revenue MAMA|BGS: Market Capitalization-to-Revenue Ratio|P/S Multiple BYND|HAIN: Price-to-Sales Ratio|Price-to-Revenue Ratio Bridgford Foods Corporation BRID|Wing Yip Food Holdings Group (WYHG) - Price to Sales|LSF - Price-to-Revenue Ratio|Price to Sales borealisfoods.ca|FARM: P/S Multiple|Market Cap to Revenue Ratio BOF|Price-to-Revenue Ratio Pinnacle Food Group Inc|Sow Good, Inc. (SOWG) - Price-to-Revenue Coefficient|Price-to-Revenue Ratio Top Wealth Group Holding Ltd (TWG)|Price-to-Revenue Coefficient Steakholder Foods Corp|P/S Multiple BSFC (Blue Star Foods Corp.)|Whole Earth Brands Inc. (FREE) - Price to Sales|LANC - Price-to-Revenue Ratio|RGF (Real Good Food) - Market Cap to Revenue Ratio|SNAX: P/S Multiple|Price to Sales Sovos Brands Corp (SOVO)