Seneca Foods Corp (SENEA) - Market Cap to Net Income
Corporate emblem and logo of Seneca Foods Corp. (SENEA)

Seneca Foods delegates agricultural production and logistics to external partners. The company's forward P/E reflects the market valuation of the asset, which currently stands at 7.60. The multiplier's dynamics are driven by the implementation of unmanned systems and packaging robotization, as well as stable sales of canned vegetables under retailer private labels, which serve as the business's primary cash generator.

Seneca Foods Corp (SENEA) Price to Earnings Ratio: for the period 07/04/2022 - 11/12/2026
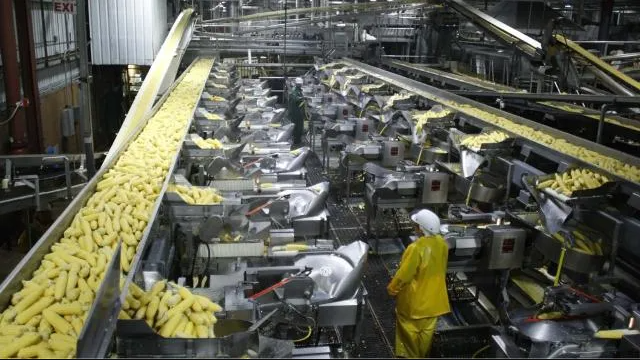
Manufactured product of Seneca Foods

The P/E ratio determines the investment payback period by comparing the current market value of a share with the company's net profit. By analyzing the current P/E of Seneca Foods (SENEA), an investor assesses the fairness of the business valuation, where low values confirm the efficiency of Seneca Foods' vertical integration and its dominance in vegetable processing, which ensures minimum production costs for retail.

Key competitors

KHC - Market Cap to Net Income Ratio|P/E Multiple K|GIS: Market Cap to Net Income|P/E Multiple MKC (McCormick & Co.)|Business Payback Period JBS USA (JBS)|HRL - Price to Earnings Ratio|SJM (jmsmucker.com) - Price to Earnings Multiple|PPC: P/E Multiple|CPB - Business Payback Period|Price to Earnings Ratio Smithfield Foods, Inc.|Corn Products International (INGR) - Business Payback Period|P/E Multiple LW|BRFS (brf-global.com) - Company Value to Net Income|P/E Multiple POST (Post Holdings)|The Marzetti Company (MZTI) - Market Cap to Earnings|BellRing Brands Inc - P/E Multiple|TR (Tootsie Roll Corp) - Price to Earnings Multiple|FLO (Flowers Foods, Inc.) - Price to Earnings Ratio|Simply Good Foods - Company Value to Net Income|NOMD (Nomad Foods) - P/E Multiple|WK Kellogg Corporation - Market Cap to Net Income|Price to Earnings Ratio J&J Snack Foods Corp. (JJSF)|UTZ - Market Cap to Earnings|Price to Earnings Ratio TreeHouse Foods, Inc. THS|sunopta.com (STKL) - Market Cap to Earnings|Sanfilippo - P/E Multiple|LWAY (Lifeway Foods Inc) - Price to Earnings Multiple|MamaMancini's (MAMA) - Price to Earnings Ratio|BGS - Business Payback Period|BYND (Beyond Meat Inc) - P/E Multiple|Market Cap to Earnings hain.com HAIN|Price to Earnings Ratio Bridgford Foods Corporation (BRID)|wingyip-food.com - Price to Earnings Multiple|P/E Multiple LSF (Laird Superfood, Inc.)|borealisfoods.ca (BRLS) - Market Cap to Earnings|Farmer Brothers - P/E Multiple|BranchOut Food Inc. (BOF) - Price to Earnings Ratio|PFAI: P/E Multiple|Sow Good (SOWG) - P/E Multiple|Price to Earnings Ratio TWG|STKH: Company Value to Net Income|P/E Multiple BSFC|FREE: Market Cap to Net Income|Price to Earnings Ratio Lancaster Colony Corporation LANC|The Real Good Food (RGF) - Market Cap to Earnings|SNAX - Price to Earnings Ratio|Market Cap to Earnings Sovos Brands Corp