SENEA - senecafoods.com Net Sales Margin
Seneca Foods Company - graphic logo of issuer SENEA

The revenue profitability level of Seneca Foods (SENEA) demonstrates the efficiency of its "field-to-can" supply chain management, where the current figure stands at 6.60. Control over agrologistics and a warehouse network minimize climate risks, supporting operating profit. High retail demand for canned goods ensures rapid asset turnover and a steady inflow of capital, confirming the manufacturer's financial stability.

Seneca Foods (SENEA) Net Margin: for the period 07/04/2022 - 11/19/2026

Comprehensive metric breakdowns and analytics for Seneca Foods Company (SENEA)
- share price and consensus valuation forecast:
Analysis of all company metrics:Seneca Foods Company - SENEA
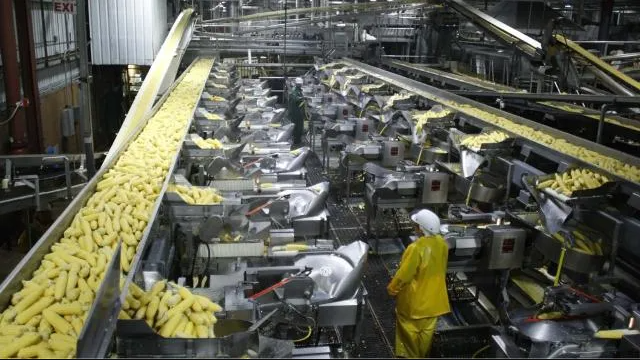
Flagship merchandise of Seneca Foods Corp.

Investors in Seneca Foods (SENEA) require a fundamental analysis to evaluate cost management efficiency via the net profit margin relative to total revenue. By analyzing the stability of sales margins, one can determine the extent to which co-packing alliances and private label processing optimize logistics, converting operational synergy into actual cash reserves, which confirms the quality of capital and the viability of the Seneca Foods business model.

Analysis of competing companies

Kraft Foods (KHC) - Net Margin|Net Return on Sales K|Net Margin generalmills.com|Net Margin McCormick & Co. MKC|Net Sales Margin JBS|Hormel Foods Corporation - Net Return on Sales|The J. M. Smucker Company - Return on Sales by Net Profit|PPC (Pilgrim's Pride Corporation) - Net Profit Margin|Campbell Soup - Net Sales Margin|Smithfield Foods, Inc. (SFD) - Return on Sales by Net Profit|Ingredion (INGR) - Net Margin|LW (lambweston.com) - Net Margin|BRFS (BRF S.A.) - Net Sales Margin|Post Consumer Brands (POST) - Company Sales Margin|Return on Sales by Net Profit MZTI (T. Marzetti Company)|Net Margin BRBR (BellRing Brands Corp)|Net Sales Margin TR (Tootsie Roll Industries, Inc.)|Net Profit Rate FLO|The Simply Good Foods - Net Sales Margin|Net Profit Rate NOMD (Nomad Foods)|wkkellogg.com (KLG) - Net Margin|J&J Snack Foods Corp. (JJSF) - Net Sales Margin|UTZ (Utz) - Net Sales Margin|Net Margin TreeHouse Foods THS|Net Sales Margin STKL|Company Sales Margin John B. Sanfilippo & Son, Inc.|Net Margin lifewaykefir.com LWAY|Net Sales Margin Mama's Creations, Inc. MAMA|BGS - Net Margin|Beyond Meat Inc - Company Net Profitability|The Hain Celestial Group (HAIN) - Net Margin|Net Margin Bridgford Foods Corp. (BRID)|WYHG (Wing Yip Food Holdings) - Net Sales Margin|Net Margin Laird Superfood LSF|Net Margin Borealis Foods, Inc. (BRLS)|Return on Sales by Net Profit Farmer Bros Co FARM|Net Sales Margin BOF (branchoutfood.com)|Net Profitability Margin Pinnacle Food Group|SOWG: Return on Sales by Net Profit|Net Profit Rate TWG (Top Wealth Group Holding Ltd)|steakholderfoods.com (STKH) - Net Margin|BSFC - Company Sales Margin|Net Margin Whole Earth Brands, Inc.|Net Sales Margin Lancaster Colony Corp|Net Sales Margin RGF|Stryve - Net Return on Sales|Sovos Brands, Inc. - Return on Sales by Net Profit