BINI: Bollinger Price-to-Revenue Coefficient
Symbol and logo of brand Bollinger Innovations Inc (BINI)

Expectations for mass deliveries of Class 4 and 5 trucks have not yet materialized, while challenges in launching serial production and capital shortages create significant risks. This P/S chart illustrates the market valuation relative to revenue, where the 0.00 level serves as a critical benchmark. Since Bollinger Innovations Inc (BINI) is currently in the pre-commercial stage, its stability depends directly on the fulfillment of existing orders.

BINI (Bollinger Innovations) P/S Multiple history from 07/29/2025 to 10/25/2025

Metric breakdowns and analytics for Bollinger Innovations Inc (BINI)
- current price and projected stock value:
Summary company analytics:Bollinger Motors, BINI
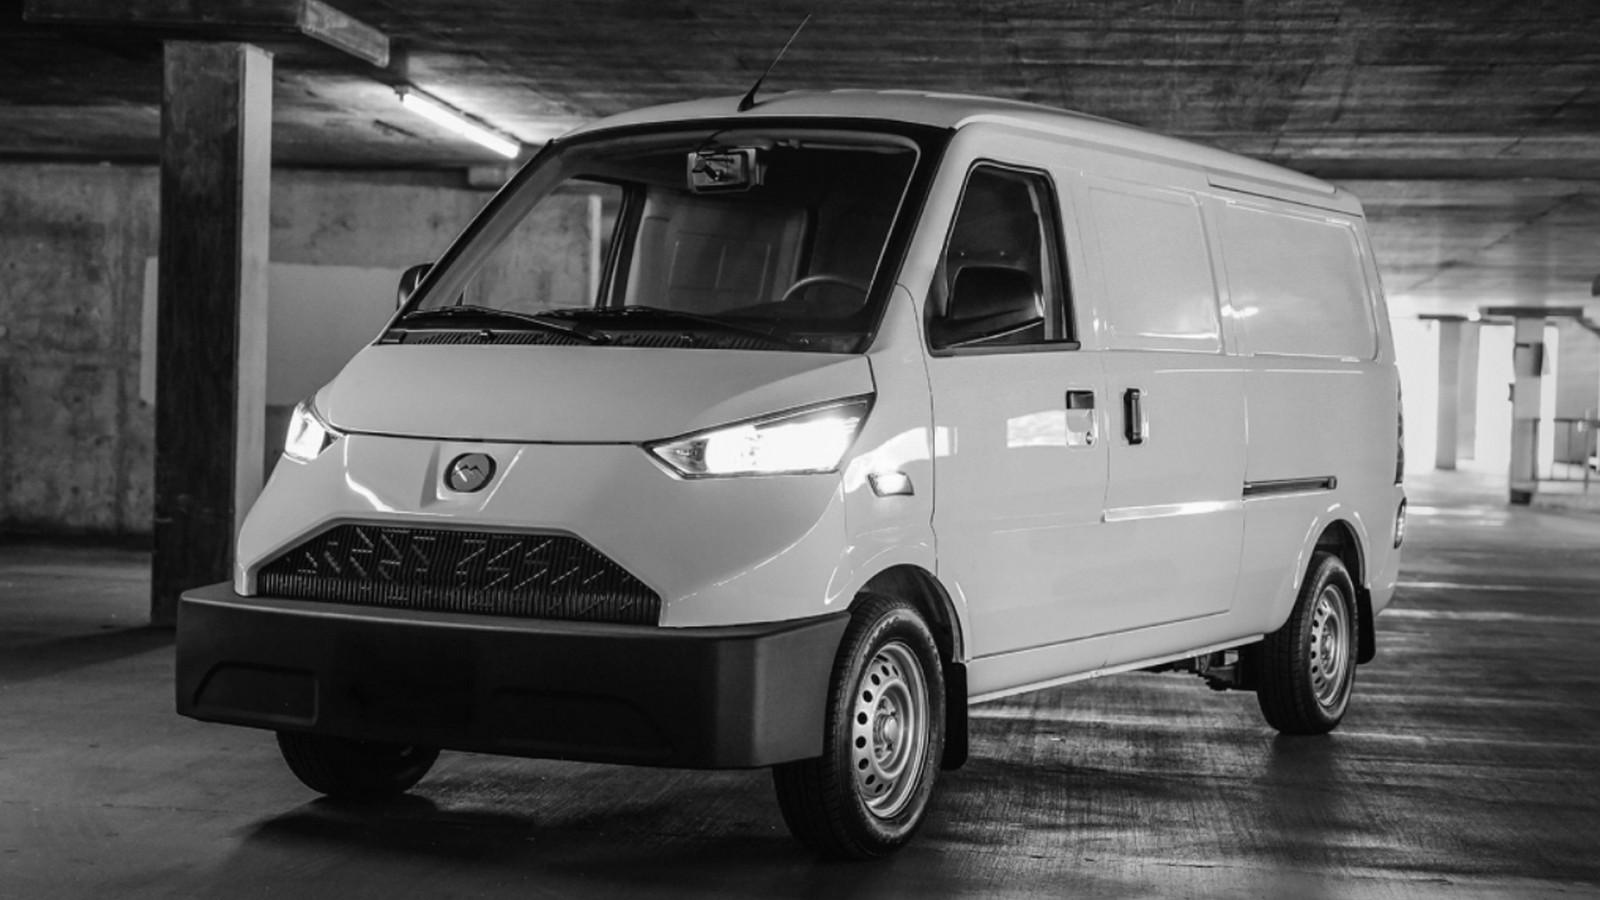
Mass-produced product of Bollinger Innovations

The P/S multiple determines the market value of a business relative to its revenue, allowing for an objective assessment of asset overheating without relying on subjective forecasts. By analyzing historical P/S trends, investors compare capitalization rates with margins, which is critical for Bollinger Innovations Inc. (BINI), as the company optimizes costs through component manufacturing outsourcing to focus on electric truck design.

Competing companies

Price-to-Revenue Ratio TSLA (tesla.com)|P/S Multiple LI (Li Auto)|Price-to-Revenue Coefficient Rivian Automotive (RIVN)|XPEV - Price-to-Revenue Ratio|NIO (NIO Inc) - Market Cap to Revenue Ratio|JOBY: P/S Multiple|Price-to-Revenue Multiple Zeekr ZK|VFS (VinFast) - P/S Multiple|Price to Sales Lucid Motors LCID|Price-to-Revenue Ratio QuantumScape Inc. (QS)|PSNY (Polestar Corp) - Market Capitalization-to-Revenue Ratio|Enovix Corporation - Market Cap to Revenue|Market Capitalization-to-Revenue Ratio AMPX|EVgo - P/S Multiple|Price-to-Revenue Coefficient Lotus Technology Inc LOT|Microvast Holdings Inc (MVST) - Price-to-Revenue Ratio|Market Cap to Revenue Ratio LVWR|Price-to-Revenue Ratio Solid Power, Inc.|Market Cap to Revenue Ratio AIIO (nwtnmotors.com)|Price-to-Revenue Ratio Hyliion (HYLN)|NIU - Price to Sales|Electrovaya Corp - Market Cap to Revenue|Faraday Future Inc. - Price-to-Revenue Ratio|ChargePoint Holdings - P/S Multiple|ABAT - P/S Multiple|NVX (novonixgroup.com) - Market Cap to Revenue|BLNK: Market Cap to Sales Volume|KNDI (Kandi Technologies Group, Inc.) - P/S Multiple|CBAK Tech (CBAT) - Price-to-Revenue Coefficient|Price-to-Revenue Ratio Wallbox N.V. (WBX)|XCH - Price to Sales|Price-to-Revenue Ratio Jiuzi Holdings JZXN|BEEM: Market Cap to Revenue Ratio|ZOOZ - Price-to-Revenue Ratio|Price-to-Revenue Coefficient Cenntro Inc CENN|SDST (stardust-power.com) - Market Cap to Revenue|Greenland Technologies Holding Corp - Market Capitalization-to-Revenue Ratio|EPOW (Sunrise New Energy) - P/S Multiple|Xos Trucks (XOS) - Price-to-Revenue Coefficient|Price-to-Revenue Ratio Dragonfly Energy Corp (DFLI)|Workhorse Corp - Market Cap to Revenue Ratio|P/S Multiple ELPW (Elong Power Holding)|SSM - Market Cap to Revenue|Fly-E Bike - P/S Multiple|STI: Price-to-Revenue Ratio|GP: P/S Multiple|UCAR - Price-to-Revenue Coefficient|Price-to-Revenue Ratio Envirotech Vehicles Inc.|Market Cap to Revenue Ratio LOBO (Lobo EV)|P/S Multiple NVVE|Price-to-Revenue Coefficient Chijet Motor Company Inc|P/S Multiple NAAS (NaaS)|EZGO Technologies Ltd (EZGO) - Price to Sales|SCAG - Price-to-Revenue Ratio|AIEV: Price-to-Revenue Ratio|ALLG: P/S Multiple|Price to Sales AYRO, Inc. (AYRO)|FFIE (Faraday Future) - P/S Multiple|Market Cap to Revenue Canoo Corp (GOEV)|Market Cap to Revenue HYZN (Hyzon Motors Inc.)|Market Cap to Sales Volume LEV|Price-to-Revenue Ratio Mullen MULN|Market Capitalization-to-Revenue Ratio PEV|SRIVARU Holding Ltd - P/S Multiple|Price-to-Revenue Coefficient Volcon, Inc. VLCN|ZAPP: P/S Multiple|Market Cap to Revenue fiskerinc.com