NIO Auto (NIO): Market Cap to Revenue Ratio

Symbol and logo of brand NIO Inc (NIO)

The capital-intensive deployment of the battery swap network in China places a heavy burden on the budget. The price-to-sales ratio clearly demonstrates these challenges, where the value of 0.40 expresses the metric level. While NIO Inc (NIO) relies on a loyal community of premium customers, the lack of pricing power and market dumping seriously limit the business's ultimate profitability.

NIO Nio Limited: Price-to-Revenue Ratio in the range 07/04/2022 - 11/13/2026
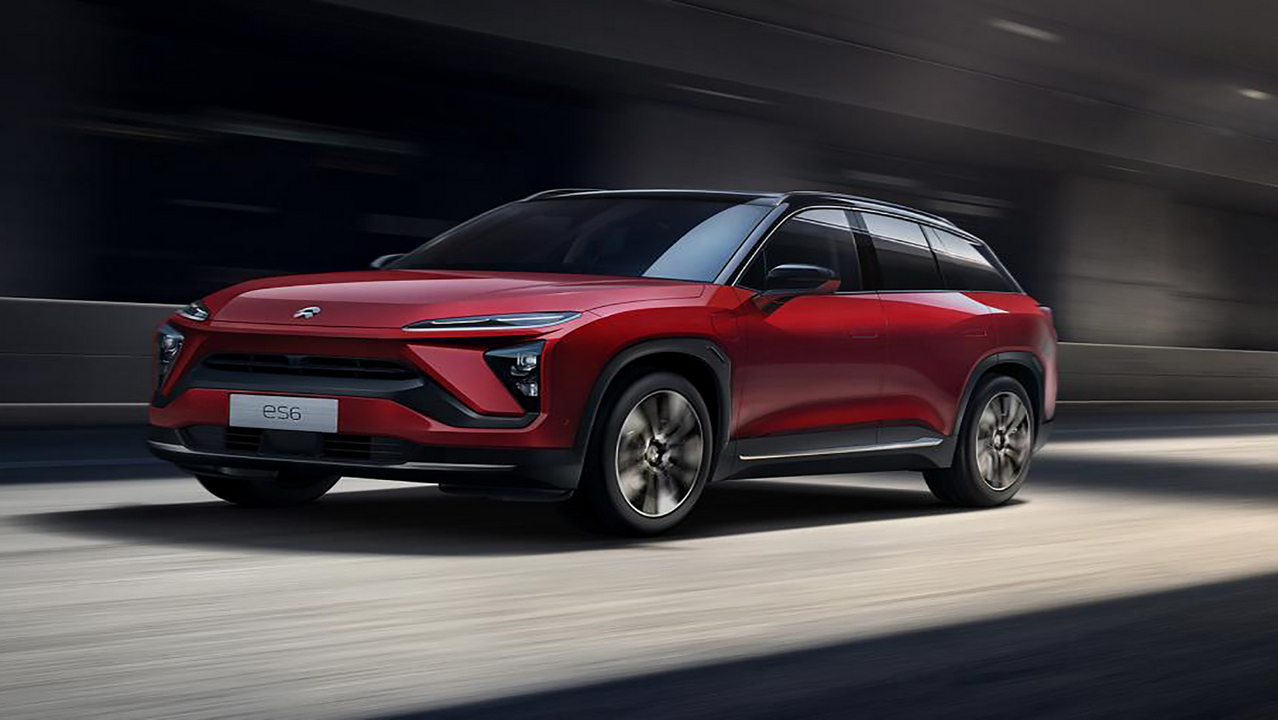
Core merchandise of Nio Limited

The P/S ratio compares the market value of NIO Inc (NIO) to its revenue, determining the premium the market is willing to pay per unit of sales. Analyzing the divergence of the P/S from its historical average helps identify asset overvaluation, which is critical for NIO Inc (NIO), as its massive investments in battery swap infrastructure temporarily hinder operational efficiency and create risks of high capital intensity.

Competitors of NIO Inc

Price-to-Revenue Coefficient tesla.com|Price-to-Revenue Ratio Li Auto LI|RIVN: Market Cap to Revenue Ratio|Xiaopeng Motors - P/S Multiple|Joby Corp (JOBY) - Market Cap to Revenue|zeekrlife.com (ZK) - Price-to-Revenue Ratio|Market Cap to Revenue Ratio VFS|LCID (Lucid) - P/S Multiple|QuantumScape Corp (QS) - Price-to-Revenue Coefficient|Price-to-Revenue Ratio Polestar EV (PSNY)|ENVX - Price to Sales|P/S Multiple AMPX (Amprius Technologies)|evgo.com (EVGO) - Price to Sales|LOT - Price-to-Revenue Ratio|MVST: Price-to-Revenue Ratio|LVWR: P/S Multiple|Price to Sales Solid Power Battery (SLDP)|AIIO (Robo.ai Inc) - P/S Multiple|Market Cap to Revenue hyliion.com (HYLN)|Market Cap to Revenue NIU (Niu Technologies)|Market Cap to Sales Volume ELVA|Price-to-Revenue Ratio FF FFAI|Market Capitalization-to-Revenue Ratio CHPT|American Battery - P/S Multiple|Price-to-Revenue Coefficient NOVONIX Limited NVX|BLNK: P/S Multiple|Market Cap to Revenue Kandi Technologies Group|Price-to-Revenue Ratio CBAK Energy Technology Inc.|Market Cap to Revenue Ratio WBX (Wallbox NV)|P/S Multiple XCH|Price-to-Revenue Coefficient zjjzxny.cn|Price-to-Revenue Ratio Beam Global, Inc. BEEM|ZOOZ Power Ltd (ZOOZ) - Price to Sales|CENN: Market Cap to Revenue|Market Capitalization-to-Revenue Ratio SDST (Stardust Power Inc.)|GTEC: P/S Multiple|EPOW - Price-to-Revenue Coefficient|Price-to-Revenue Ratio Xos Inc.|Market Cap to Revenue Ratio DFLI (Dragonfly Energy Holdings Corp.)|P/S Multiple WKHS|Market Cap to Revenue Elong Power Corp ELPW|Price-to-Revenue Ratio Sono Group N.V SSM|FLYE: Market Cap to Revenue Ratio|Solidion - P/S Multiple|Price-to-Revenue Coefficient GreenPower Motor GP|upincar.com (UCAR) - Price-to-Revenue Ratio|Price to Sales Envirotech Vehicles, Inc. (EVTV)|LOBO (Lobo EV Technologies Limited) - P/S Multiple|Price to Sales nuvve.com NVVE|Price-to-Revenue Ratio Chijet Motor Company, Inc. (CJET)|Price-to-Revenue Ratio NAAS (NaaS Technology Inc)|P/S Multiple EZGO (EZGO Technologies)|Bollinger Motors (BINI) - Price to Sales|Scage - P/S Multiple|Thunder Power Holdings (AIEV) - Market Cap to Revenue|ALLG (allego.eu) - Market Cap to Revenue|AYRO: Market Cap to Sales Volume|Price-to-Revenue Ratio Faraday Future|GOEV: Market Capitalization-to-Revenue Ratio|P/S Multiple HYZN|Price-to-Revenue Coefficient The Lion Electric|P/S Multiple MULN (Mullen)|PEV - Market Cap to Revenue|SVMH - Price-to-Revenue Ratio|VLCN (Volcon, Inc.) - Market Cap to Revenue Ratio|ZAPP: P/S Multiple|FSR - Price-to-Revenue Coefficient