Greenland Tech (GTEC): Market Cap to Revenue Ratio

Corporate company logo of Greenland Tech (GTEC)

The development of industrial electric vehicles and transmissions provides Greenland Technologies (GTEC) with moderate growth, as confirmed by the price-to-sales multiple. Dominance in the Chinese excavator and loader segment strengthens B2B positioning, while the transition to robotic assembly accelerates equipment production. The current 0.10 trend shows the value of this parameter, filtering out market noise and demonstrating the real value of the business relative to its trading volumes.

gtec-tech.com - GTEC P/S Multiple (period 07/04/2022 - 11/14/2026)

Analytical breakdowns for Greenland Technologies (GTEC)
- current quotes and average value forecast:
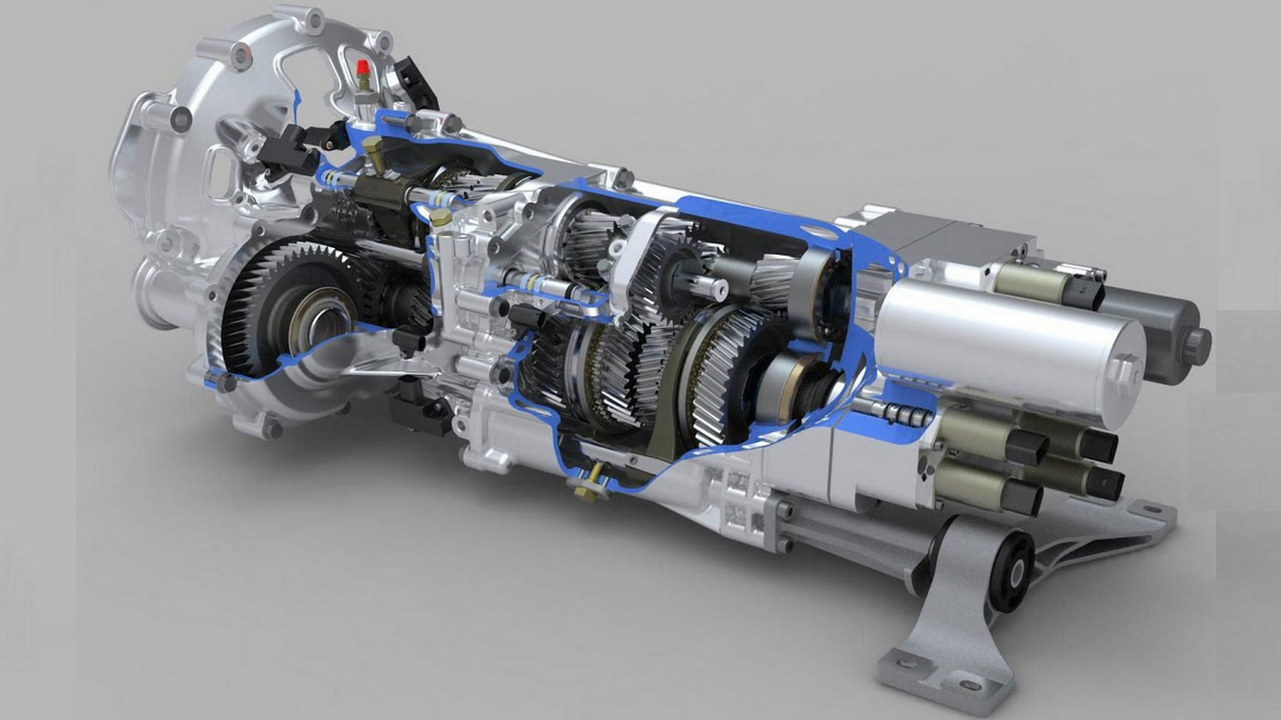
Manufactured products of Greenland Technologies Holding Corp.

The investment attractiveness of Greenland Technologies (GTEC) is based on the implementation of a decarbonization strategy through the production of eco-friendly industrial equipment. The P/S metric determines the market value of the business relative to its annual sales volume, reflecting a premium for future revenue growth. By analyzing the P/S ratio dynamics of Greenland Technologies (GTEC), an investor can assess the extent of the overpayment for an ESG-oriented production model. This indicator serves as the foundation for determining the fairness of the current capitalization relative to actual cash flows.

Who Greenland Technologies competes with

TSLA - Price to Sales|Price-to-Revenue Ratio Li Auto LI|RIVN: Market Cap to Revenue Ratio|XPEV - Price-to-Revenue Ratio|NIO: Price-to-Revenue Ratio|JOBY: P/S Multiple|Zeekr (ZK) - P/S Multiple|Price-to-Revenue Ratio VinFast|Market Cap to Revenue Ratio LCID (Lucid Motors)|P/S Multiple QS|Polestar Corp - Market Cap to Revenue Ratio|Enovix Corporation - Market Cap to Revenue|Market Capitalization-to-Revenue Ratio AMPX|EVGO: Market Cap to Revenue|Lotus Technology Inc - Market Cap to Sales Volume|MVST: P/S Multiple|Price to Sales LiveWire Corp (LVWR)|SLDP (Solid Power, Inc.) - P/S Multiple|Market Cap to Revenue nwtnmotors.com (AIIO)|P/S Multiple HYLN|NIU (niu.com) - Market Capitalization-to-Revenue Ratio|Price-to-Revenue Ratio Electrovaya Corp ELVA|FFAI: Market Cap to Revenue Ratio|CHPT - Price-to-Revenue Ratio|Price to Sales americanbatterytechnology.com|novonixgroup.com (NVX) - Price-to-Revenue Ratio|BLNK (Blink Charging) - Price-to-Revenue Ratio|Price-to-Revenue Ratio Kandi Technologies Group, Inc.|Price to Sales CBAK Tech CBAT|P/S Multiple WBX|xcharge.com (XCH) - Price-to-Revenue Multiple|P/S Multiple JZXN (Jiuzi Holdings)|Price-to-Revenue Coefficient Beam Global Inc (BEEM)|ZOOZ Power, Ltd. - P/S Multiple|Price to Sales Cenntro Inc|stardust-power.com (SDST) - Price-to-Revenue Ratio|EPOW - Price-to-Revenue Coefficient|XOS (Xos Inc.) - P/S Multiple|DFLI - Price-to-Revenue Multiple|Market Cap to Revenue WKHS (Workhorse Group Inc)|Market Cap to Sales Volume ELPW|P/S Multiple SSM (Sono Group N.V)|Fly E Group (FLYE) - Price to Sales|Solidion - P/S Multiple|GreenPower Motor (GP) - Market Cap to Revenue|UCAR: P/S Multiple|Price to Sales Envirotech Vehicles, Inc. (EVTV)|Price-to-Revenue Ratio Lobo EV Technologies Limited|Price-to-Revenue Ratio NVVE|P/S Multiple CJET|NAAS - Price to Sales|P/S Multiple EZGO (EZGO Technologies)|BINI - Market Cap to Revenue|SCAG: Market Cap to Revenue|Thunder Power Holdings - Market Cap to Sales Volume|allego.eu (ALLG) - Price-to-Revenue Ratio|AYRO, Inc. - Market Capitalization-to-Revenue Ratio|FFIE (Faraday Future) - P/S Multiple|Canoo Corp (GOEV) - Price-to-Revenue Coefficient|P/S Multiple HYZN|Market Cap to Revenue The Lion Electric LEV|P/S Multiple MULN (Mullen)|Price-to-Revenue Multiple Phoenix Motor|SVMH - Price-to-Revenue Ratio|Market Capitalization-to-Revenue Ratio VLCN (Volcon, Inc.)|ZAPP: P/S Multiple|Price to Sales fiskerinc.com (FSR)