LVWR - LiveWire Group Market Cap to Revenue

Symbol and logo of brand LiveWire Corp (LVWR)

The historical P/S trend for LiveWire Group, Inc. (LVWR) demonstrates the impact of geopolitics and tariffs on the cost of electric motorcycles. The 2.90 indicator shows the level of this metric, which fluctuates due to assembly dependence on Harley-Davidson capacities. Meanwhile, high product pricing and weak demand are eroding the business's defensive barriers, creating risks of stagnation amid global competition in the electric vehicle segment.

livewire.com (LVWR): Price-to-Revenue Ratio from 04/28/2023 to 11/13/2026

LiveWire EV (LVWR) - metric breakdowns and financial figures
- current quotes and average value forecast:
- market capitalization statistics:
General company analysis:LiveWire Group, Inc.
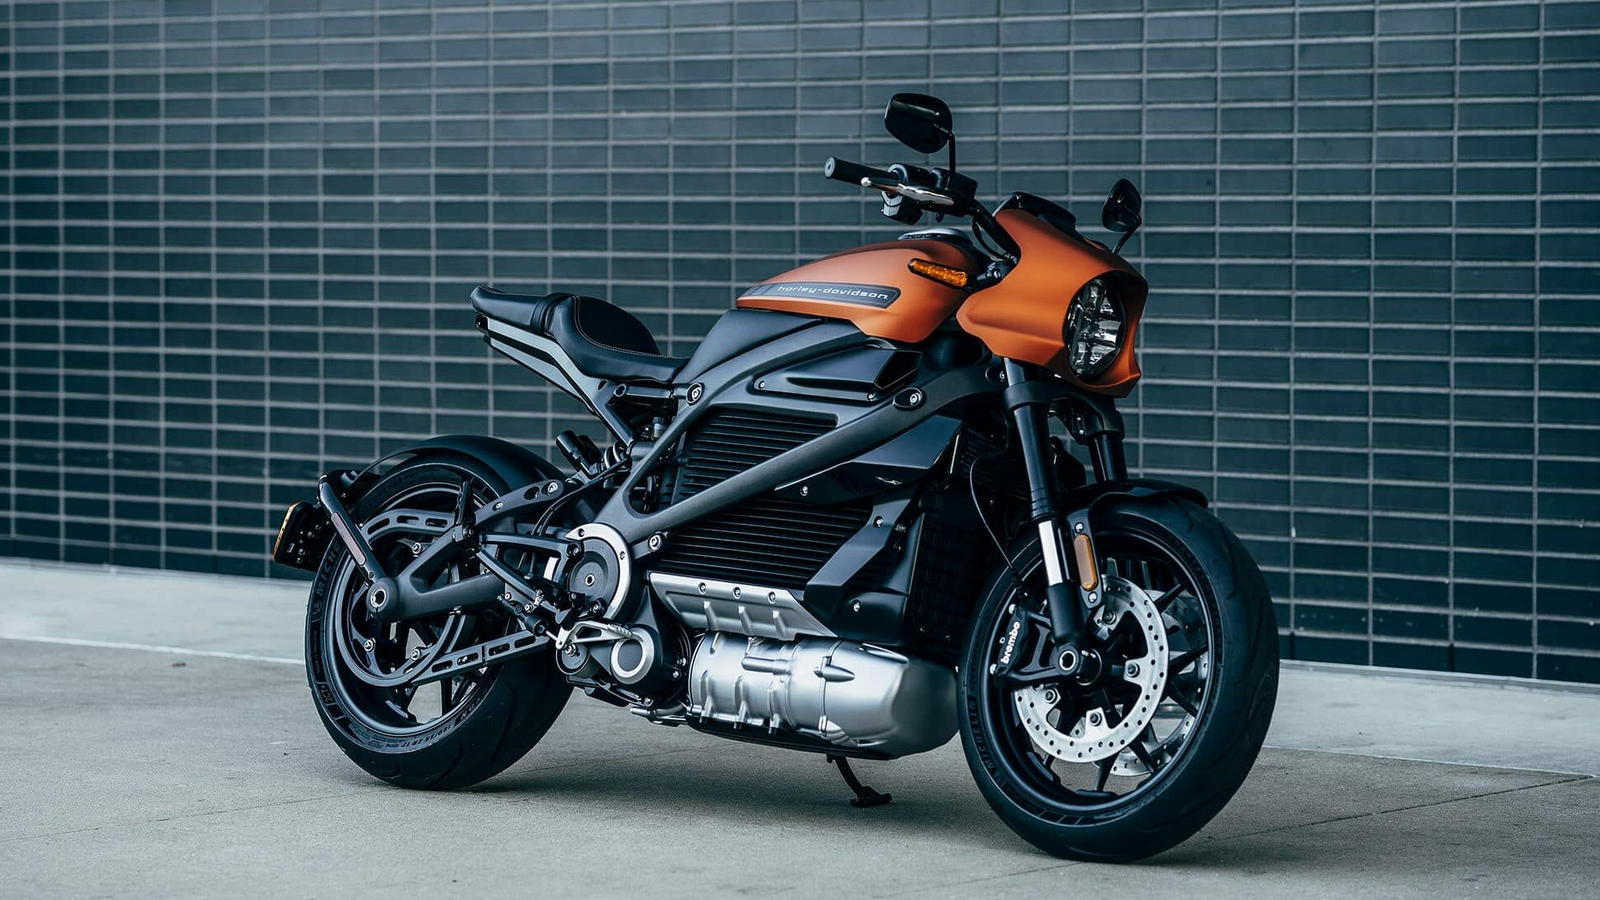
Mass-produced product of LiveWire Corp

The P/S multiple determines the market value of a single unit of revenue, allowing an investor to assess asset monetization efficiency and reporting transparency through the sensitivity of capitalization to sales volumes. For LiveWire Group, Inc. (LVWR), this metric reflects the market valuation of business resilience amid trade conflicts and rare earth metal shortages, which is clearly demonstrated in the price action of the market-to-sales ratio.

Competitors of LiveWire Group, Inc.

TSLA - Price to Sales|Li Auto - Market Cap to Revenue|RIVN - Market Cap to Revenue|Xiaopeng Motors - P/S Multiple|Price-to-Revenue Coefficient NIO Inc NIO|Joby Aviation, Inc. (JOBY) - Price-to-Revenue Ratio|Zeekr - Market Capitalization-to-Revenue Ratio|VFS (VinFast) - P/S Multiple|Price to Sales Lucid Motors LCID|Market Cap to Revenue QS (QuantumScape Inc.)|PSNY (Polestar Corp) - Market Capitalization-to-Revenue Ratio|P/S Multiple ENVX (Enovix Corporation)|Price-to-Revenue Multiple amprius.com|EVGO - Price-to-Revenue Ratio|Market Capitalization-to-Revenue Ratio LOT (Lotus Technology Inc)|Microvast Holdings Inc (MVST) - Price-to-Revenue Ratio|Price to Sales Solid Power Battery (SLDP)|Market Cap to Revenue AIIO|P/S Multiple hyliion.com|Price-to-Revenue Ratio Niu Technologies (NIU)|ELVA: Price-to-Sales Ratio|FF - Market Cap to Revenue|Market Capitalization-to-Revenue Ratio CHPT|American Battery - P/S Multiple|Price-to-Revenue Coefficient NOVONIX Limited NVX|blinkcharging.com (BLNK) - Price-to-Revenue Ratio|Market Cap to Revenue Ratio KNDI|CBAT (CBAK Energy Technology Inc.) - P/S Multiple|Market Cap to Revenue Wallbox NV (WBX)|Market Cap to Revenue XCH (XCHG Ltd ADR)|Price-to-Revenue Coefficient zjjzxny.cn|Price-to-Revenue Ratio Beam Global, Inc. BEEM|ZOOZ Power Ltd - Price-to-Revenue Ratio|CENN: Market Cap to Revenue|SDST: Price-to-Revenue Ratio|GTEC (gtec-tech.com) - Market Cap to Revenue|Market Cap to Revenue Sunrise New Energy Co. Ltd.|Price-to-Revenue Ratio Xos Inc.|DFLI: Market Capitalization-to-Revenue Ratio|P/S Multiple WKHS|ELPW - Price to Sales|Price-to-Revenue Ratio Sono Group N.V SSM|Fly E Group - Price-to-Revenue Ratio|Solidion - P/S Multiple|Price to Sales GreenPower Motor|UCAR: P/S Multiple|Market Cap to Revenue Envirotech Vehicles, Inc.|Market Cap to Revenue LOBO|NVVE (nuvve.com) - Market Cap to Sales Volume|Price-to-Revenue Ratio Chijet Motor Company, Inc. (CJET)|NAAS (NaaS Technology Inc) - Market Capitalization-to-Revenue Ratio|P/S Multiple EZGO (EZGO Technologies)|Price-to-Revenue Coefficient Bollinger Motors (BINI)|Scage - P/S Multiple|Thunder Power Holdings (AIEV) - Market Cap to Revenue|allego.eu (ALLG) - Price-to-Revenue Ratio|AYRO (AYRO, Inc.) - Price-to-Revenue Ratio|FFIE (Faraday Future) - P/S Multiple|Canoo Corp (GOEV) - Price-to-Revenue Coefficient|Market Cap to Revenue HYZN (Hyzon Motors Inc.)|Price-to-Revenue Ratio LEV (The Lion Electric)|P/S Multiple MULN (Mullen)|Phoenix Motor (PEV) - Price to Sales|SVMH: Market Cap to Revenue|Volcon, Inc. (VLCN) - Market Cap to Revenue|ZAPP: P/S Multiple|FSR - Price-to-Revenue Coefficient