FLO - Flowers Foods Inc Market Capitalization-to-Revenue Ratio
Corporate company logo of Flowers Foods Inc (FLO)

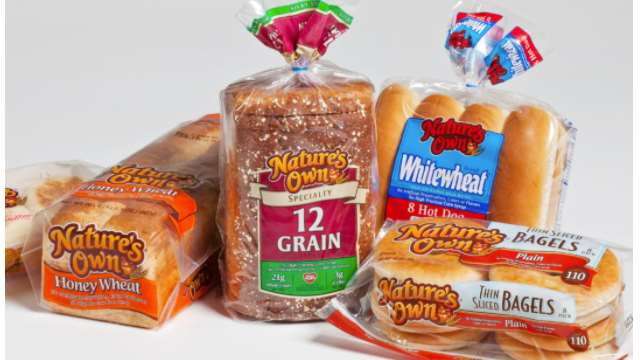
Demand volatility for Nature's Own and Wonder baked goods impacts the price-to-sales ratio of Flowers Foods, Inc. (FLO), where the value 0.20 reflects the current figure. Flowers Foods, Inc. (FLO) revenues are based on the sale of packaged bread through retail chains. High barriers to entry are ensured by a unique direct-store-delivery system, which confirms the business's resilience on the chart.

Flowers Bakeries (FLO) - Price-to-Revenue Ratio from 07/04/2022 to 11/16/2026

Analytical breakdowns for Flowers Foods (FLO)
- stock price and consensus target price:
- market capitalization statistics:
General company analysis:Flowers Foods Inc - FLO
Mass-produced product of flowersfoods.com

Professional capital assesses the resilience of Flowers Foods, Inc. (FLO) by comparing market value with actual revenue streams to offset the impact of raw material inflation and competition from private labels. By analyzing the price-to-sales multiple, the investor determines the degree of business overvaluation: inflated values signal a risk of correction, while excessively low values indicate stagnating operational metrics and low asset reliability.

Competitors of Flowers Foods, Inc.

Kraft Heinz Corp - Market Cap to Revenue Ratio|Price-to-Revenue Ratio kelloggcompany.com K|Market Capitalization-to-Revenue Ratio GIS|McCormick & Co. - P/S Multiple|Price-to-Sales Ratio JBS|Hormel Corp (HRL) - Price-to-Revenue Ratio|Price to Sales J.M. Smucker (SJM)|Price-to-Revenue Ratio pilgrims.com|Price to Sales Campbell Soup Co. CPB|P/S Multiple SFD|INGR - Price to Sales|P/S Multiple LW (lambweston.com)|BRFS: Market Cap to Revenue Ratio|POST - Price-to-Revenue Ratio|T. Marzetti Company - Market Cap to Sales Volume|BRBR: P/S Multiple|TR: Market Cap to Sales Volume|SMPL (Simply Good Foods Co.) - P/S Multiple|Market Cap to Revenue Nomad Foods (NOMD)|P/S Multiple KLG|JJSF (J&J Snack Foods Inc) - Market Capitalization-to-Revenue Ratio|Price-to-Revenue Ratio Utz Brands, Inc. UTZ|TreeHouse Foods (THS) - Price to Sales|STKL: Market Cap to Revenue|JBSS: Price-to-Revenue Ratio|SENEA: P/S Multiple|Price to Sales Lifeway Foods, Inc. (LWAY)|Price-to-Revenue Ratio Mama's Creations, Inc.|B&G Foods (BGS) - Price-to-Revenue Coefficient|P/S Multiple BYND|HAIN (The Hain Celestial Group) - Market Capitalization-to-Revenue Ratio|Bridgford Foods Corp - Market Cap to Revenue|WYHG (Wing Yip Food) - Price-to-Sales Ratio|Laird Superfood - P/S Multiple|Price to Sales Borealis Foods, Inc.|FARM (Farmer Bros. Co.) - Market Cap to Revenue|Price to Sales BranchOut Food, Inc. (BOF)|PFAI (Pinnacle Food Group Inc.) - P/S Multiple|thisissowgood.com (SOWG) - Price-to-Revenue Coefficient|Market Cap to Revenue TWG (Top Wealth Group Ltd)|STKH - Price to Sales|Price-to-Revenue Ratio bluestarfoods.com BSFC|P/S Multiple Whole Earth Brands FREE|LANC: Market Cap to Revenue|Price to Sales The Real Good Food Company Inc.|SNAX (stryve.com) - Market Cap to Revenue|SOVO - Price-to-Revenue Coefficient