Flowers Foods Inc (FLO) Price to Earnings Multiple
Corporate emblem and logo of Flowers Foods Inc (FLO)

Flowers Foods, Inc. (FLO) dominates the bakery segment thanks to a powerful direct distribution system. The price-to-earnings ratio on the GURU.Markets terminal line chart captures current dynamics, where 37.80 represents the latest metric reading. Risks are linked to raw material volatility and pricing pressure, however, the company is implementing eco-friendly packaging and reducing its production carbon footprint.

Flowers Foods (FLO) Price to Earnings Ratio: for the period 07/04/2022 - 11/17/2026

Comprehensive metric breakdowns and analytics for Flowers Foods Inc (FLO)
- market value and analyst target forecast:
Summary company analysis:Flowers Bakeries FLO
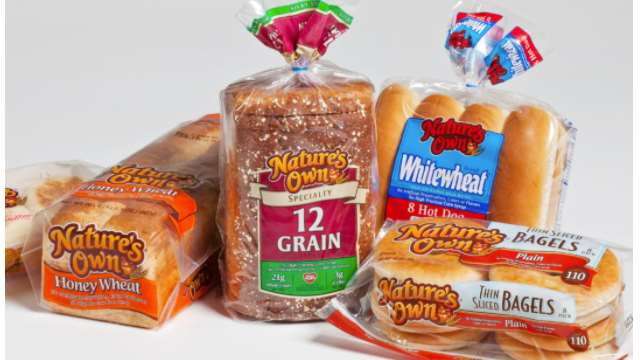
Flagship merchandise of Flowers Foods

The efficiency of the direct store delivery system and the strong brands of Flowers Foods, Inc. (FLO) are reflected in the company's current P/E ratio, which compares the business's market value to its net income. This ratio determines the investment payback period, signaling an overvaluation of the asset during periods of excessive market optimism or an undervaluation of fundamental earnings during temporary lulls.

Competing companies

Kraft Heinz Company (KHC) - Business Payback Period|Price to Earnings Ratio Kellanova Corp (K)|General Mills Corp - Price to Earnings Multiple|P/E Multiple MKC (mccormickcorporation.com)|Business Payback Period JBS N.V. (JBS)|HRL - Price to Earnings Ratio|Business Payback Period Smucker's SJM|PPC: P/E Multiple|Campbell Soup Co. - Company Value to Net Income|SFD (Smithfield) - P/E Multiple|INGR: Company Value to Net Income|Price to Earnings Ratio LW (Lamb Weston Holdings, Inc.)|BRFS - Market Cap to Earnings|P/E Multiple POST (Post Holdings, Inc.)|MZTI: Price to Earnings Multiple|BRBR: Price to Earnings Ratio|Market Cap to Earnings tootsie.com|SMPL: P/E Multiple|Market Cap to Net Income NOMD (Nomad Foods Ltd)|Price to Earnings Ratio wkkellogg.com|Market Cap to Earnings J&J Snack Foods Inc JJSF|P/E Multiple UTZ|TreeHouse Foods - Price to Earnings Multiple|P/E Multiple STKL (SunOpta Corp)|JBSS: Price to Earnings Multiple|Seneca Foods - P/E Multiple|LWAY: Price to Earnings Ratio|MAMA: P/E Multiple|Market Cap to Net Income Ratio B&G Foods BGS|Price to Earnings Ratio BYND|Market Cap to Earnings Hain Celestial HAIN|P/E Multiple BRID|Wing Yip Food Group (WYHG) - Market Cap to Net Income Ratio|Laird Superfood, Inc. - Price to Earnings Ratio|P/E Multiple Borealis Foods, Inc. BRLS|FARM - Price to Earnings Ratio|Market Cap to Earnings BranchOut Food, Inc.|Pinnacle Food Group Inc (PFAI) - Price to Earnings Ratio|Market Cap to Earnings Sow Good Inc (SOWG)|Price to Earnings Ratio TWG|Price to Earnings Ratio STKH|Price to Earnings Ratio Blue Star Foods Corp (BSFC)|FREE (Whole Earth) - Company Value to Net Income|Lancaster Colony Corp. - Price to Earnings Ratio|Real Good Foods (RGF) - Market Cap to Earnings|Stryve Foods - P/E Multiple|SOVO (sovosbrands.com) - Price to Earnings Multiple