HCHL: Happy City Price-to-Revenue Coefficient

Symbol and logo of brand Happy City (HCHL)

A lack of FoodTech breakthroughs and modest digitalization are constraining the potential of Happy City Holdings Ltd (HCHL), as confirmed by the Price-to-Sales ratio, where the parameter is 32.70. Price action relies on increasing traffic in the Asian food service sector and automation. Meanwhile, the business is protected by its focus on the domestic market, although it remains susceptible to inflationary pressures.

HCHL (Happy City Holdings) P/S Multiple history from 06/25/2025 to 06/27/2026

Analytical breakdowns for gyugyushabushabu.com (HCHL)
Fundamental company analysis:Happy City Holdings Ltd - HCHL
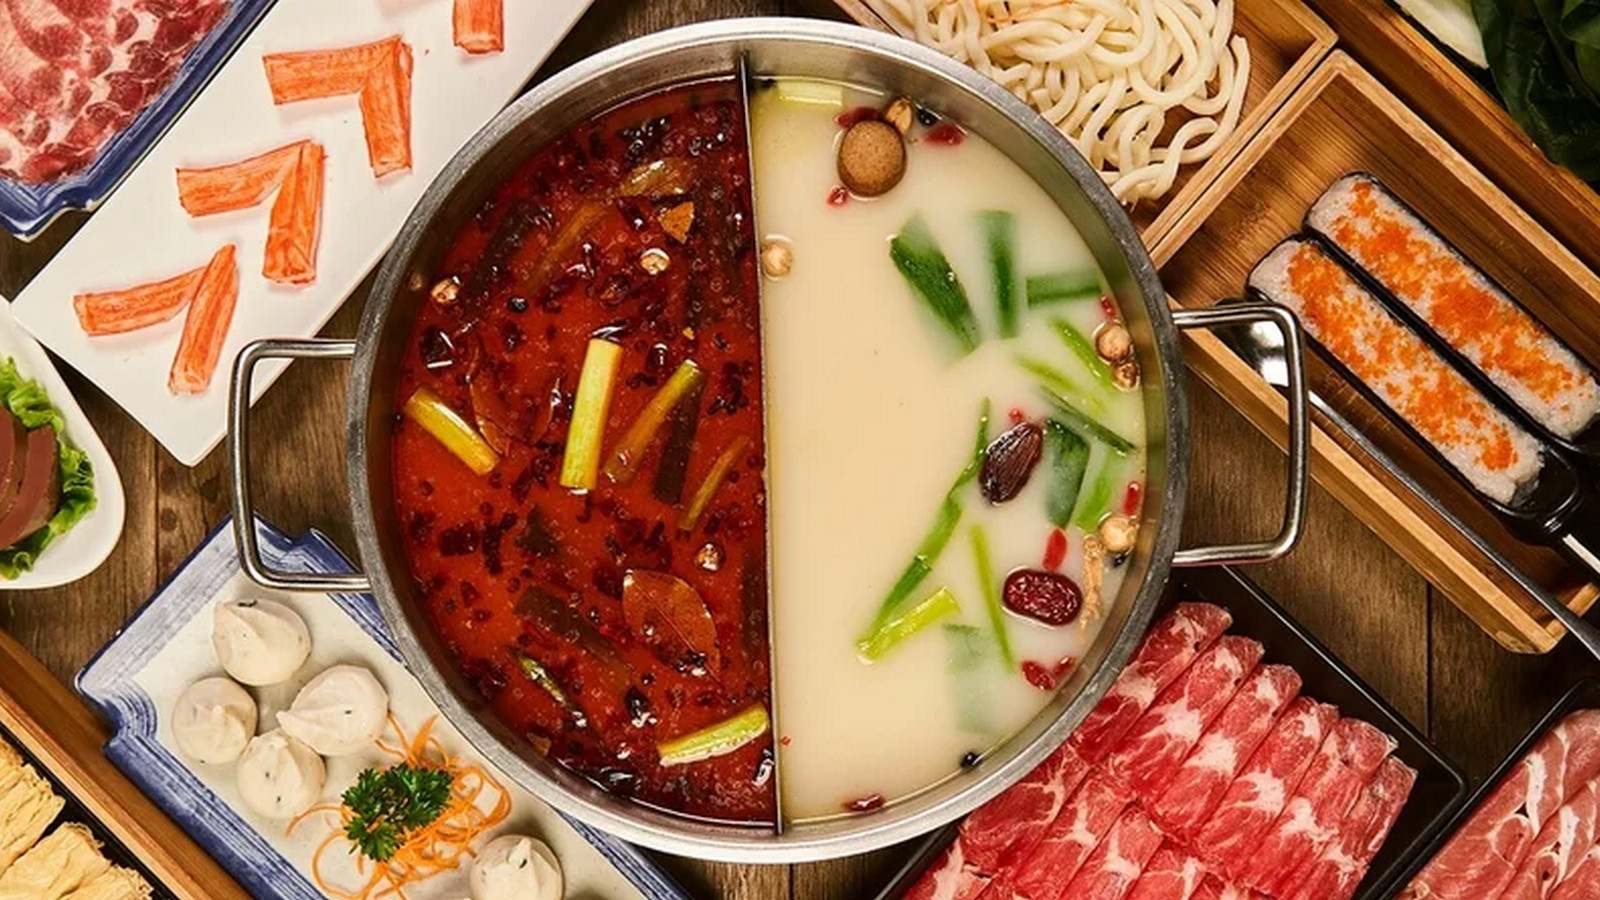
Finished products of Happy City Holdings Ltd

When screening issuer reliability, it is critical to evaluate the ratio of market capitalization to total revenue, which determines the value of a single dollar of sales in the eyes of investors. In analyzing the P/S ratio of Happy City Holdings Ltd (HCHL), one must consider that an inflated valuation amid cost inflation and customer outflow to China significantly reduces the asset's margin of safety during a market correction.

Competitors of Happy City Holdings Ltd

Price-to-Revenue Coefficient McDonalds|P/S Multiple SBUX (Starbucks Coffee Company)|CMG: Market Cap to Revenue Ratio|Yum Brands Inc - P/S Multiple|Price-to-Revenue Multiple sysco.com (SYY)|Restaurant Brands International (QSR) - Price-to-Revenue Ratio|Market Cap to Revenue Ratio DRI|Market Cap to Revenue TOST|P/S Multiple US Foods Corp|Market Cap to Revenue YUMC (Yum China Corp)|Market Cap to Revenue Domino's Pizza, Inc. DPZ|Texas Roadhouse Corp - Market Cap to Revenue|P/S Multiple Aramark Corp ARMK|Dutch Bros Corp - P/S Multiple|CAVA - P/S Multiple|wingstop.com (WING) - Price-to-Revenue Ratio|Market Cap to Revenue Middleby Corporation|Price-to-Revenue Ratio Brinker International, Inc.|SHAK: Market Capitalization-to-Revenue Ratio|P/S Multiple CAKE|The Wendy's Company - Market Cap to Revenue Ratio|Price-to-Revenue Ratio Olo Inc OLO|Market Capitalization-to-Revenue Ratio PZZA|ARCO - Price-to-Revenue Ratio|Black Rock Coffee Bar Inc. (BRCB) - Market Cap to Revenue|Super Hi International (HDL) - Price-to-Revenue Ratio|Cracker Barrel Stores (CBRL) - P/S Multiple|Price-to-Revenue Ratio Sweetgreen|FWRG: Market Capitalization-to-Revenue Ratio|Price-to-Revenue Ratio Biglari Holdings Inc (BH)|P/S Multiple Kura Revolving Sushi Bar (KRUS)|Price-to-Revenue Ratio Dave & Buster's Inc. PLAY|BJRI: Market Cap to Revenue Ratio|BLMN - Price-to-Revenue Ratio|Price-to-Revenue Coefficient krispykreme.com DNUT|Potbelly (PBPB) - Price-to-Revenue Ratio|Karat Packaging - Market Capitalization-to-Revenue Ratio|Market Cap to Revenue PTLO|P/S Multiple Dine Brands Global Inc|P/S Multiple JACK|Price-to-Revenue Ratio LOCO (El Pollo Loco Holdings)|Price-to-Revenue Ratio Denny's Corp. DENN|Price-to-Revenue Multiple Twin Hospitality Group Inc|MasterBeef Group Ltd - P/S Multiple|RRGB: Price-to-Revenue Ratio|GEN Korean BBQ (GENK) - Price-to-Revenue Ratio|STKS: Market Cap to Sales Volume|BDL (Flanigan's) - P/S Multiple|P/S Multiple Rave Restaurant Group, Inc.|P/S Multiple FAT|Market Cap to Revenue Giftify, Inc. GIFT|Noodles & Company Inc. - Market Cap to Revenue|Market Capitalization-to-Revenue Ratio ARKR|Vestand Inc - P/S Multiple|Price to Sales Li Bang International|HWH International (HWH) - Price-to-Revenue Ratio|GTIM - Price-to-Revenue Coefficient|Price-to-Revenue Ratio Premium Catering Holdings Limited|Market Cap to Revenue BT Brands, Inc. (BTBD)|P/S Multiple BFI|Price-to-Revenue Ratio CHUY (Chuy's)|Price-to-Revenue Ratio Sushi Ginza Onodera Inc ONDR|Price-to-Revenue Coefficient Pinstripes Holdings Inc (PNST)|Presto Automation Inc. - P/S Multiple|Price-to-Revenue Coefficient yoshiharuramen.com YOSH|TWNPV (twinpeaksrestaurant.com) - Market Cap to Revenue