Haidilao Overseas (HDL): Market Cap to Revenue Ratio

Brandmark of Super Hi International Corp (HDL)

International expansion and the growth of overseas sales are creating powerful momentum for Super Hi International (HDL). The smoothed P/S ratio for the company on the GURU.Markets chart demonstrates the asset's current position, where the indicator value reaches 0.70. Aggressive development in Asia and Europe, coupled with high customer loyalty, supports this growth, while strict control over logistics and sanitary standards creates a significant barrier to entry for competitors.

Super Hi International Holding Ltd. (HDL) Price-to-Revenue Ratio: for the period 05/18/2024 - 11/13/2026

Metric breakdowns and analytics for Super Hi International Corp (HDL)
General company analysis:HDL - superhiinternational.com
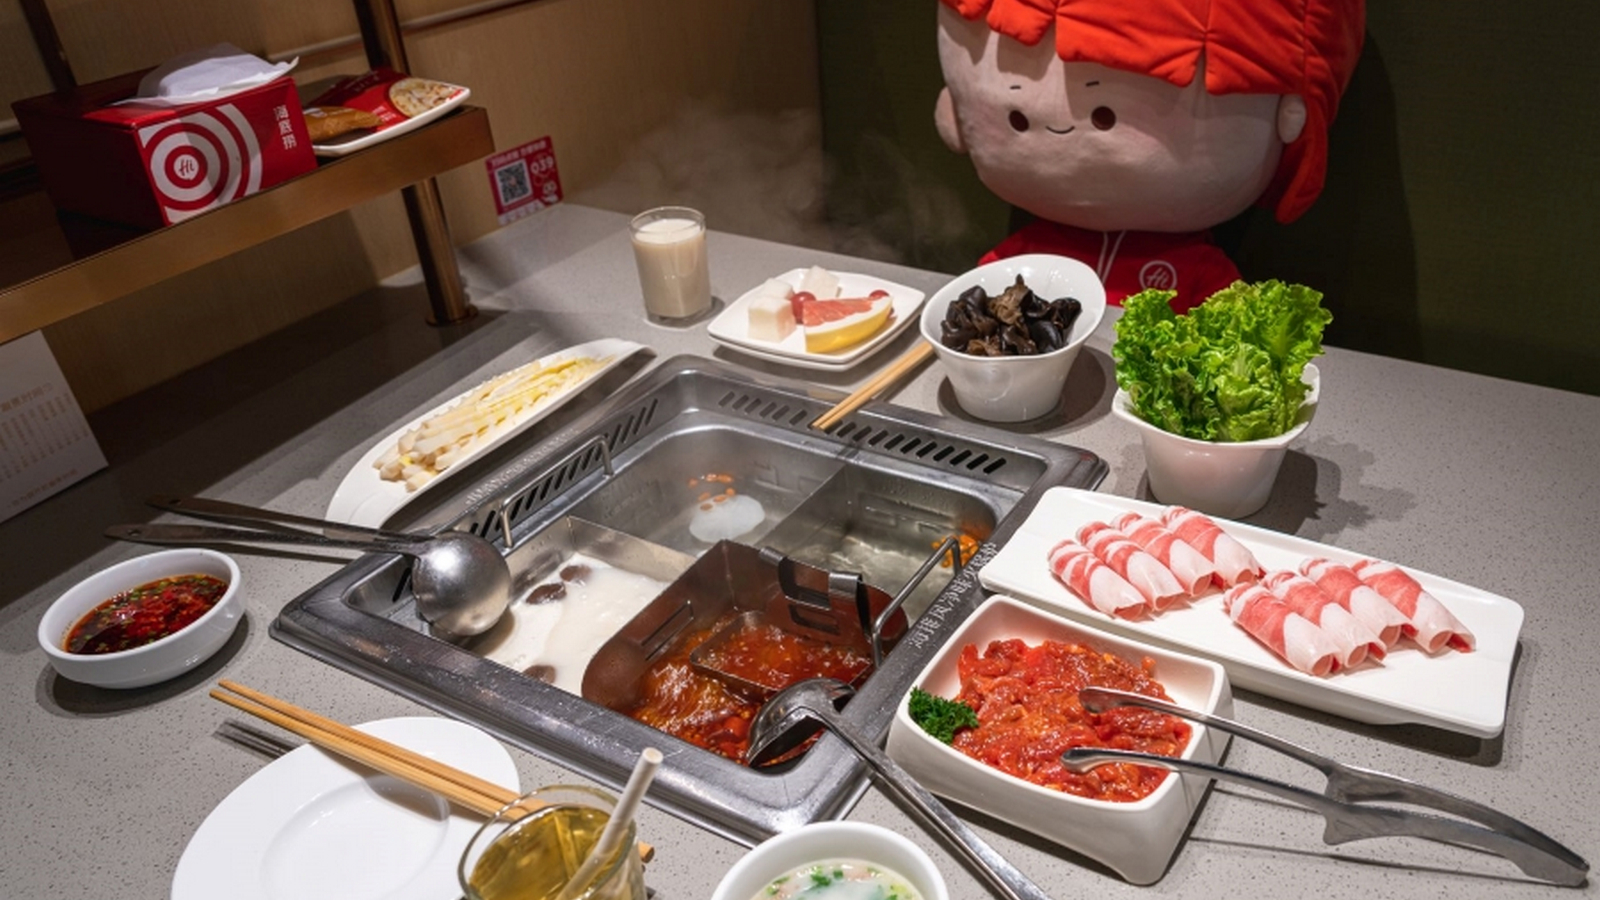
Signature product of Haidilao Overseas

Professional selection of resilient assets begins with an analysis of the price-to-sales ratio to identify whether a business is overvalued or undervalued. By evaluating the historical P/S trend, an investor can discern monetization efficiency, which in the case of Super Hi International (HDL) is supported by exceptional staff loyalty and a lack of competency shortages, guaranteeing stable revenue growth during expansion.

Competitors of Super Hi International

Price-to-Revenue Coefficient corporate.mcdonalds.com|Price-to-Revenue Ratio Starbucks SBUX|CMG: Market Cap to Revenue Ratio|Yum! - P/S Multiple|Price-to-Revenue Multiple Sysco Corp. (SYY)|RBI (QSR) - Price-to-Revenue Ratio|DRI - Price-to-Revenue Coefficient|Market Cap to Revenue TOST|P/S Multiple US Foods, Inc.|Price-to-Revenue Ratio Yum China Inc. (YUMC)|DPZ: Price-to-Sales Ratio|P/S Multiple TXRH (Texas Roadhouse, Inc.)|aramark.com (ARMK) - Price to Sales|BROS - Price-to-Revenue Ratio|Market Capitalization-to-Revenue Ratio CAVA (CAVA Group, Inc.)|WING (Wingstop Inc) - Market Cap to Revenue|Middleby Marshall - Market Capitalization-to-Revenue Ratio|EAT (Brinker International) - P/S Multiple|SHAK: Market Capitalization-to-Revenue Ratio|P/S Multiple CAKE|Price-to-Revenue Coefficient Wendy's Company|Olo Platform - Market Cap to Revenue|Market Capitalization-to-Revenue Ratio PZZA|McDonald's Latin America - P/S Multiple|Price-to-Revenue Coefficient br.coffee BRCB|Cracker Barrel Old Country Store (CBRL) - Price-to-Revenue Ratio|Market Cap to Revenue Ratio SG|Market Cap to Revenue FWRG|BH (Biglari Corp) - Market Cap to Sales Volume|P/S Multiple KRUS|PLAY - Price to Sales|Price-to-Revenue Ratio BJ's Restaurants BJRI|Market Capitalization-to-Revenue Ratio BLMN|DNUT - Price-to-Revenue Ratio|PBPB (Potbelly Corporation Inc.) - Market Cap to Revenue Ratio|KRT: P/S Multiple|portillos.com (PTLO) - P/S Multiple|Market Cap to Revenue DIN|JACK (Jack in the Box Inc) - Market Cap to Sales Volume|P/S Multiple LOCO|Price-to-Revenue Coefficient Denny's Diner|Price-to-Revenue Ratio Twin Hospitality Group TWNP|masterbeef.hk (MB) - Price to Sales|RRGB - Price-to-Revenue Ratio|GENK (GEN Restaurant Group Inc) - Market Cap to Revenue Ratio|STKS: P/S Multiple|Flanigan's Enterprises Inc (BDL) - P/S Multiple|Price-to-Revenue Ratio raverg.com|Price-to-Revenue Ratio FAT|P/S Multiple GIFT|NDLS (Noodles & Co) - Market Capitalization-to-Revenue Ratio|P/S Multiple ARKR (Ark Restaurants)|VSTD: Market Cap to Revenue Ratio|LBGJ - Price-to-Revenue Ratio|HWH: Price-to-Revenue Ratio|Good Times Restaurants Inc. (GTIM) - Price-to-Revenue Ratio|Price-to-Sales Ratio PC (Premium Catering Holdings)|Market Cap to Revenue BTBD|P/S Multiple Happy City|P/S Multiple BFI|Price-to-Revenue Ratio CHUY (chuys.com)|Price-to-Revenue Ratio Sushi Ginza Onodera ONDR|Pinstripes Holdings, Inc. - Price-to-Revenue Ratio|Presto Automation Inc - P/S Multiple|Price-to-Revenue Coefficient Yoshiharu Global Co. YOSH|TWNPV: P/S Multiple