PC: Premium Catering Holdings Limited Price-to-Revenue Multiple

Symbol and logo of brand Premium Catering Holdings Limited (PC)

The P/S multiple dynamics for Premium Catering (Holdings) (PC) correlate with the risks of losing government contracts and rising raw material costs, with the indicator remaining around 6.60. Business efficiency is based on the diversification of Singapore's food bases to protect margins. Supply stability is ensured through flexible outsourcing of warehousing and transport operations via a pool of vetted contractors.

premium-catering.com.sg (PC) - Price-to-Revenue Ratio from 11/15/2024 to 11/01/2025

Metric breakdowns and analytics for premium-catering.com.sg (PC)
- stock price and consensus target price:
General company analysis:PC, Premium Catering Holdings Limited
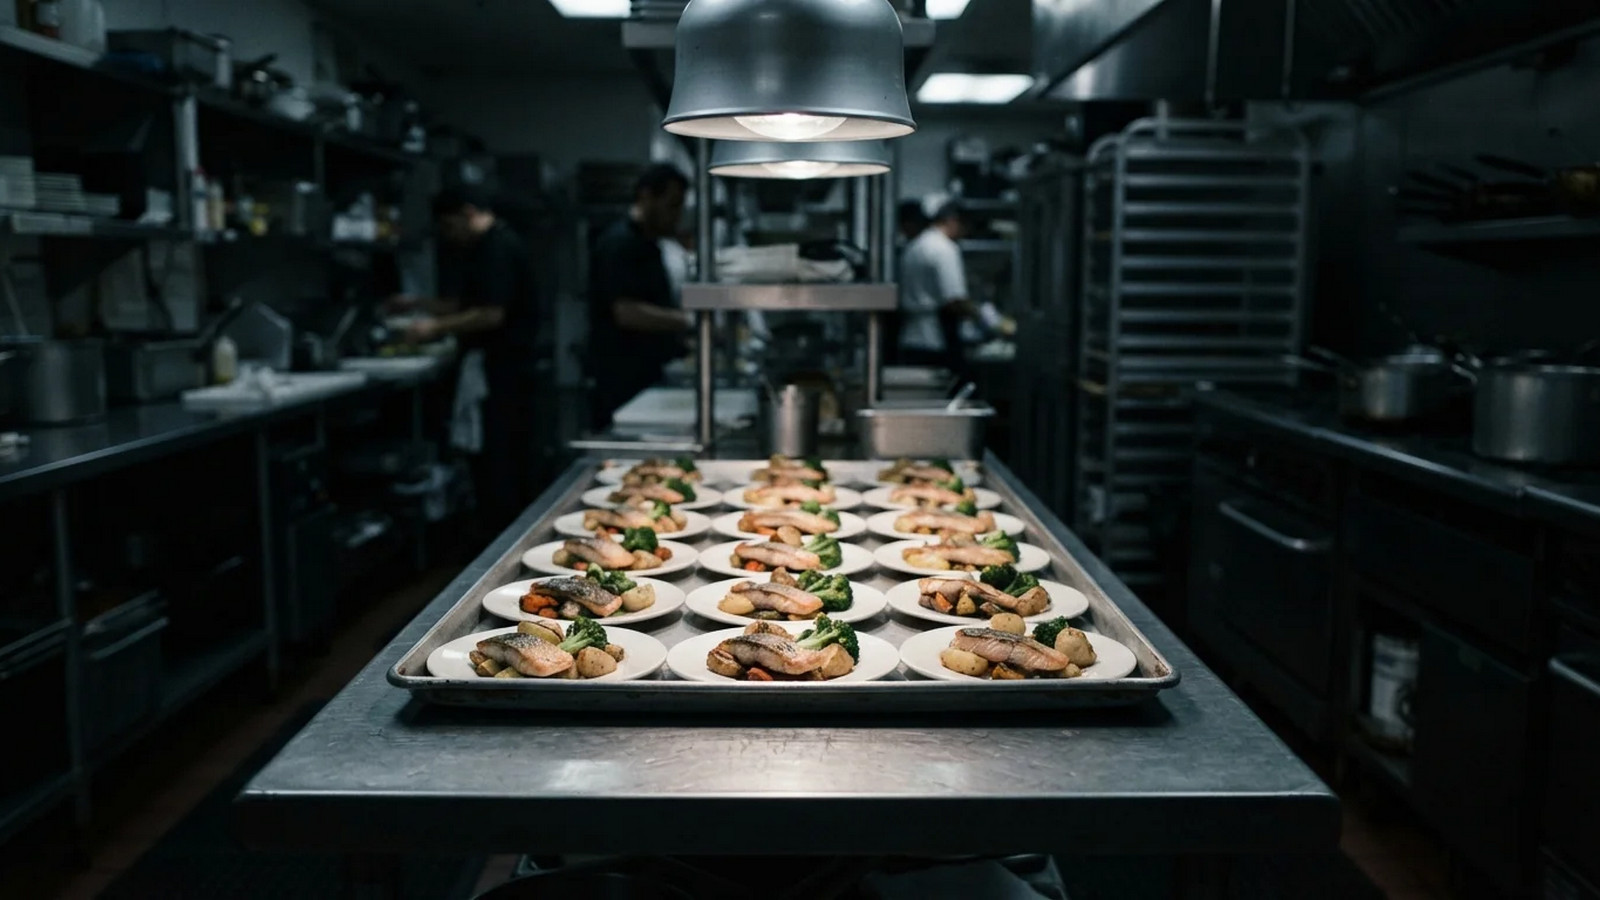
Mass-produced product of Premium Catering (Holdings)

Premium Catering (PC) dependence on Singaporean government contracts and raw material inflation makes revenue a key indicator of resilience. The P/S multiple correlates the business's market value with its sales volume, determining how much an investor pays per unit of revenue. This metric allows for the rapid identification of asset undervaluation or the risk of capital stagnation. By analyzing historical P/S dynamics, one can detect price anomalies and assess management efficiency.

Who Premium Catering (Holdings) competes with

Price-to-Revenue Coefficient McDonalds|P/S Multiple SBUX (Starbucks Coffee Company)|CMG: Market Cap to Revenue Ratio|Yum Brands Inc - P/S Multiple|Price-to-Revenue Multiple sysco.com (SYY)|Restaurant Brands International (QSR) - Price-to-Revenue Ratio|Market Cap to Revenue Ratio DRI|Market Cap to Revenue TOST|P/S Multiple US Foods Corp|Market Cap to Revenue YUMC (Yum China Corp)|Market Cap to Revenue Domino's Pizza, Inc. DPZ|Texas Roadhouse Corp - Market Cap to Revenue|P/S Multiple Aramark Corp ARMK|Dutch Bros Corp - P/S Multiple|CAVA - P/S Multiple|wingstop.com (WING) - Price-to-Revenue Ratio|Market Cap to Revenue Middleby Corporation|Price-to-Revenue Ratio Brinker International, Inc.|SHAK: Market Capitalization-to-Revenue Ratio|P/S Multiple CAKE|The Wendy's Company - Market Cap to Revenue Ratio|Price-to-Revenue Ratio Olo Inc OLO|Market Capitalization-to-Revenue Ratio PZZA|ARCO - Price-to-Revenue Ratio|Black Rock Coffee Bar Inc. (BRCB) - Market Cap to Revenue|Super Hi International (HDL) - Price-to-Revenue Ratio|Cracker Barrel Stores (CBRL) - P/S Multiple|Price-to-Revenue Ratio Sweetgreen|FWRG: Market Capitalization-to-Revenue Ratio|Price-to-Revenue Ratio Biglari Holdings Inc (BH)|P/S Multiple Kura Revolving Sushi Bar (KRUS)|Price-to-Revenue Ratio Dave & Buster's Inc. PLAY|BJRI: Market Cap to Revenue Ratio|BLMN - Price-to-Revenue Ratio|Price-to-Revenue Coefficient krispykreme.com DNUT|Potbelly (PBPB) - Price-to-Revenue Ratio|Karat Packaging - Market Capitalization-to-Revenue Ratio|Market Cap to Revenue PTLO|P/S Multiple Dine Brands Global Inc|P/S Multiple JACK|Price-to-Revenue Ratio LOCO (El Pollo Loco Holdings)|Price-to-Revenue Ratio Denny's Corp. DENN|Price-to-Revenue Multiple Twin Hospitality Group Inc|MasterBeef Group Ltd - P/S Multiple|RRGB: Price-to-Revenue Ratio|GEN Korean BBQ (GENK) - Price-to-Revenue Ratio|STKS: Market Cap to Sales Volume|BDL (Flanigan's) - P/S Multiple|P/S Multiple Rave Restaurant Group, Inc.|P/S Multiple FAT|Market Cap to Revenue Giftify, Inc. GIFT|Noodles & Company Inc. - Market Cap to Revenue|Market Capitalization-to-Revenue Ratio ARKR|Vestand Inc - P/S Multiple|Price to Sales Li Bang International|HWH International (HWH) - Price-to-Revenue Ratio|GTIM - Price-to-Revenue Coefficient|BTBD (itsburgertime.com) - P/S Multiple|HCHL: Market Capitalization-to-Revenue Ratio|P/S Multiple BFI|Price-to-Revenue Ratio CHUY (Chuy's)|Price-to-Revenue Ratio Sushi Ginza Onodera Inc ONDR|Price-to-Revenue Coefficient Pinstripes Holdings Inc (PNST)|Presto Automation Inc. - P/S Multiple|Price-to-Revenue Coefficient yoshiharuramen.com YOSH|TWNPV (twinpeaksrestaurant.com) - Market Cap to Revenue