RAVE: Pie Five Pizza Price-to-Revenue Coefficient

Corporate company logo of Rave Restaurant Group Inc (RAVE)

Rave Restaurant relies on an asset-light model of collecting royalties from franchisees, ensuring a stable cash flow. The implementation of AI algorithms for ordering and inventory management optimizes the network's operations. The current P/S ratio demonstrates the multiplier's dynamics, where the metric value stands at 2.30. However, global inflation and food shortages are driving up procurement costs, which significantly reduces the overall business margins in the US.

RAVE (Rave Restaurant) P/S Multiple history from 07/04/2022 to 11/13/2026

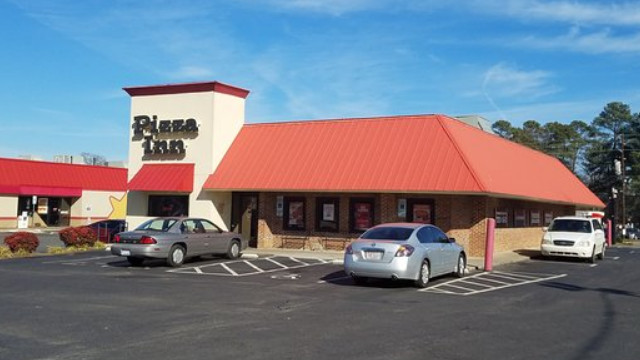
Analytical breakdowns for Pizza Inn (RAVE)
Summary company analytics:raverg.com RAVE
Finished products of Pizza Inn

The P/S ratio determines the market value of a business relative to its annual sales volume. The ratio of market capitalization to revenue measures the premium investors are willing to pay per unit of income. Analyzing P/S volatility allows for the identification of long-term asset valuation trends. Low metric values for Rave Restaurant (RAVE) confirm the chain's lack of pricing power amid fierce competition with fast-food behemoths.

Competing companies

MCD (corporate.mcdonalds.com) - Market Capitalization-to-Revenue Ratio|P/S Multiple SBUX (Starbucks)|Price-to-Revenue Coefficient Chipotle Mexican Grill, Inc. (CMG)|YUM - Price-to-Revenue Ratio|SYY (Sysco Corp.) - Market Cap to Revenue Ratio|QSR: P/S Multiple|Price-to-Revenue Multiple darden.com DRI|Price-to-Revenue Ratio Toast|USFD: Market Capitalization-to-Revenue Ratio|P/S Multiple YUMC|P/S Multiple Domino's Pizza Corp (DPZ)|Texas Roadhouse, Inc. - Market Cap to Revenue|aramark.com - Price-to-Revenue Ratio|Dutch Bros - P/S Multiple|Price to Sales CAVA Group, Inc.|WING (Wingstop Inc) - Market Cap to Revenue|Middleby Marshall - Market Capitalization-to-Revenue Ratio|Price-to-Revenue Ratio Brinker International|SHAK: Market Capitalization-to-Revenue Ratio|P/S Multiple CAKE|WEN - Price to Sales|Price-to-Revenue Ratio Olo Platform OLO|Price-to-Revenue Coefficient Papa John's Pizza (PZZA)|ARCO: Market Cap to Revenue|br.coffee - Market Cap to Sales Volume|HDL: P/S Multiple|Cracker Barrel Old Country Store, Inc. (CBRL) - P/S Multiple|Market Cap to Revenue SG|P/S Multiple First Watch Restaurant Group, Inc.|Price-to-Revenue Ratio Biglari Holdings Inc. (BH)|KRUS (kurasushi.com) - Market Capitalization-to-Revenue Ratio|P/S Multiple PLAY (Dave & Buster's Entertainment)|P/S Multiple BJ's Restaurants Inc BJRI|BLMN - Price-to-Revenue Ratio|DNUT (Krispy Kreme Corp) - Market Cap to Revenue Ratio|PBPB (Potbelly Corporation) - Market Cap to Revenue|KRT: Market Cap to Sales Volume|Price-to-Revenue Ratio Portillo's|DIN: Market Capitalization-to-Revenue Ratio|P/S Multiple JACK|P/S Multiple El Pollo Loco Holdings Inc. (LOCO)|Denny's Corporation - Market Cap to Revenue|Twin Hospitality - Price-to-Revenue Ratio|MasterBeef - P/S Multiple|Price to Sales Red Robin Gourmet Burgers|GEN Korean BBQ (GENK) - Price-to-Revenue Ratio|Price-to-Sales Ratio STKS (ONE Group Hospitality)|Market Cap to Revenue BDL|P/S Multiple Fatburger|P/S Multiple GIFT|Price-to-Revenue Ratio NDLS (Noodles & Co)|Price-to-Revenue Ratio Ark Restaurants ARKR|Vestand Inc. - Price-to-Revenue Ratio|Li Bang - P/S Multiple|Price-to-Revenue Coefficient hwhintl.com HWH|GTIM: P/S Multiple|Market Cap to Revenue Premium Catering Holdings|Market Cap to Revenue BTBD|HCHL: Market Capitalization-to-Revenue Ratio|P/S Multiple BFI|Market Cap to Revenue chuys.com CHUY|P/S Multiple ONDR (Sushi Ginza Onodera)|P/S Multiple Pinstripes Holdings, Inc. PNST|PRST: Market Cap to Revenue|Yoshiharu Global Co. - Market Cap to Sales Volume|TWNPV: P/S Multiple