R: Ryder System Inc Price to Sales
Corporate company logo of Ryder Truck Rental (R)

The estimated P/S reflects market expectations for the cost of capital at Ryder System, Inc. (R). The current status of the 0.80 metric is based on B2B revenues from vehicle leasing and warehouse logistics. AI implementation optimizes routing, although technical service remains manual. Long-term contracts ensure a stable cash flow, guaranteeing business resilience and the absence of technological obsolescence.

R: ryder.com Market Cap to Revenue 07/04/2022 - 11/13/2026

Ryder System Inc (R) - metric breakdowns and financial figures
- stock price and consensus target price:
- market capitalization information:
Fundamental company analysis:R, ryder.com
Core merchandise of Ryder

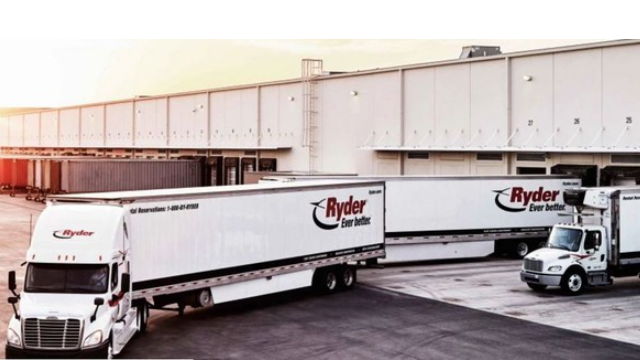
The financial stability of Ryder System, Inc. (R) is underpinned by a massive fleet of trucks and service centers, which ensures the stability of leasing flows. The ratio of market capitalization to annual sales, reflected in the price-to-sales dynamics, allows for the valuation of each unit of revenue, where an increasing coefficient signals a premium on the business, while a decrease indicates a market reassessment of the efficiency of infrastructure asset utilization.

Who Ryder System, Inc. competes with

up.com - Market Cap to Revenue Ratio|P/S Multiple PLD (Prologis)|Canadian Pacific (CP) - Price to Sales|NSC - Price-to-Revenue Ratio|Market Capitalization-to-Revenue Ratio CSX (CSX Corporation)|CNI (Canadian National Railway) - Market Cap to Revenue|paccar.com - Market Capitalization-to-Revenue Ratio|Price-to-Revenue Ratio Public Storage, Inc.|C.H. Robinson Worldwide Inc (CHRW) - Price-to-Revenue Coefficient|Market Cap to Revenue XPO (XPO, Inc.)|UHAL - Price to Sales|Price-to-Revenue Ratio Saia, Inc. SAIA|Price-to-Revenue Coefficient tfiintl.com (TFII)|KNX: Market Cap to Revenue|GATX Corporation - Market Cap to Sales Volume|LSTR: P/S Multiple|Price to Sales Schneider Logistics (SNDR)|Price-to-Revenue Ratio RXO Corp|Market Cap to Revenue trin.net (TRN)|Market Cap to Revenue WERN (werner.com)|DSGR (Distribution Solutions Group) - Market Capitalization-to-Revenue Ratio|P/S Multiple SCSC (ScanSource Corp)|Price-to-Revenue Coefficient Heartland Express Inc. (HTLD)|HY - Price-to-Revenue Ratio|ULH (universallogistics.com) - Market Cap to Revenue Ratio|CVLG: P/S Multiple|Market Cap to Revenue Wabash National Corporation|Market Cap to Revenue OMI|Radiant (RLGT) - Price-to-Revenue Coefficient|Price-to-Revenue Ratio P.A.M. Transportation Services, Inc. (PAMT)|PAL (proficientautologistics.com) - Market Capitalization-to-Revenue Ratio|Price-to-Revenue Ratio FreightCar America, Inc. RAIL|MingZhu Logistics Holdings Limited - Price-to-Revenue Ratio|ELOG - Price-to-Revenue Ratio|Price to Sales Haoxin|ATXG: P/S Multiple|Price-to-Revenue Multiple Cheetah Net Supply Chain Corp. CTNT|EZFL (EZFill Holdings) - P/S Multiple|Nikola Motor (NKLA) - Price-to-Revenue Coefficient|Price-to-Revenue Ratio PAM Transportation (PTSI)|Price-to-Revenue Coefficient Daseke Corporation