Union Pacific Corporation (UNP): Market Cap to Revenue Ratio

Corporate company logo of up.com (UNP)

Cost optimization supports high margins during the cycle stabilization period. The revenue multiple dynamics on GURU.Markets reflect this effect, with the indicator holding around 6.90. The unique network across western states guarantees stability due to indispensable infrastructure. Meanwhile, shipping cyclicality and the autumn season determine profitability, which is protected by the monopoly status of Union Pacific (UNP).

Union Pacific (UNP): Price-to-Revenue Ratio from 07/04/2022 to 11/13/2026

Union Pacific (UNP) - metric breakdowns and financial figures
- stock value and consensus price forecast:
Fundamental company analysis:Union Pacific Corporation - UNP
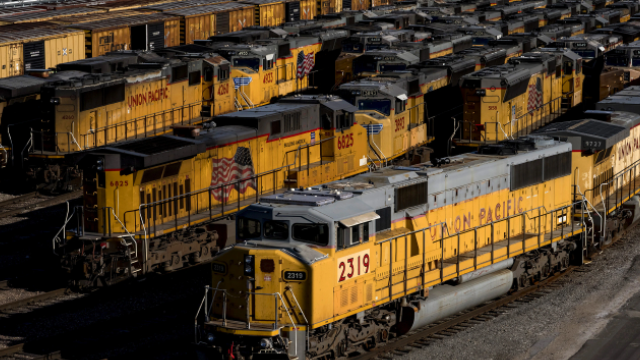
Manufactured products of Union Pacific Railroad

To select high-quality assets, an investor must compare the market value of a business with its actual sales volume. The P/S ratio measures the premium to revenue, which, under Union Pacific (UNP)'s duopoly, confirms the company's ability to capitalize on its pricing power and pass costs onto customers; therefore, the P/S ratio trend serves as an indicator of whether the current business valuation is justified.

Competing companies

P/S Multiple prologis.com (PLD)|Price-to-Revenue Ratio CPKC CP|NSC: Market Cap to Revenue Ratio|CSX Corp. - P/S Multiple|Price-to-Revenue Coefficient CN Rail CNI|PACCAR Inc (PCAR) - Price-to-Revenue Ratio|Price to Sales publicstorage.com (PSA)|Price-to-Revenue Ratio C.H. Robinson Worldwide, Inc.|Market Cap to Revenue Ratio XPO (XPO Corp)|Market Cap to Revenue UHAL (U-Haul Corp)|SAIA (Saia Motor Freight Line) - Market Capitalization-to-Revenue Ratio|Price-to-Revenue Ratio TFI International Inc. TFII|R (ryder.com) - Price-to-Sales Ratio|Knight-Swift - P/S Multiple|GATX - P/S Multiple|LSTR: P/S Multiple|Market Cap to Revenue Schneider Logistics|RXO (RXO Corp) - P/S Multiple|trin.net (TRN) - Price-to-Revenue Coefficient|P/S Multiple WERN|DSGR: Price-to-Sales Ratio|P/S Multiple SCSC (ScanSource Corp)|Price-to-Revenue Coefficient Heartland Express Inc. (HTLD)|Hyster-Yale Corp - P/S Multiple|universallogistics.com (ULH) - Market Cap to Revenue|CVLG (Covenant Logistics Group) - Market Cap to Revenue|Wabash National Corporation (WNC) - P/S Multiple|Price-to-Revenue Ratio Owens & Minor Corp|Market Cap to Revenue Ratio RLGT (Radiant)|Price-to-Revenue Ratio P.A.M. Transportation Services, Inc. (PAMT)|PAL: Price-to-Sales Ratio|Price-to-Revenue Ratio FreightCar America, Inc. RAIL|MingZhu Logistics Holdings Limited - Price-to-Revenue Ratio|ELOG - Price-to-Revenue Ratio|Price to Sales Haoxin|ATXG: P/S Multiple|Price-to-Revenue Multiple Cheetah Net Supply Chain Corp. CTNT|EZFL (EZFill Holdings) - P/S Multiple|Nikola Motor (NKLA) - Price-to-Revenue Coefficient|Price-to-Revenue Ratio PAM Transportation (PTSI)|Price-to-Revenue Coefficient Daseke Corporation