EZFL: EZFill Holdings Inc. Price to Sales
Symbol and logo of brand EZFill Holdings Inc. (EZFL)

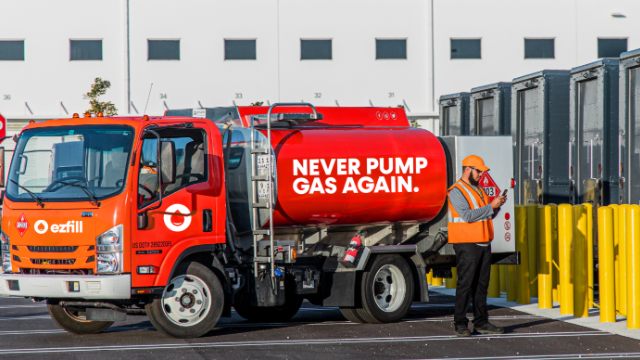
The technological development of EZFill Holdings Inc. (EZFL) is limited to basic software and route optimization, leading to stagnant innovation. The price-to-sales ratio reflects this stagnation through the risk of a valuation correction. Revenues are based on mobile vehicle refueling via the application. Cash flow stability relies on corporate contracts in a growth phase, while 0.80 serves as the current metric level.

getyourezfill.com (EZFL) - P/S Multiple from 07/04/2022 to 02/14/2025

Metric breakdowns and analytics for EZFill (EZFL)
- share price and consensus valuation forecast:
Fundamental company analysis:getyourezfill.com EZFL
Core merchandise of getyourezfill.com

The P/S ratio determines the market value of a business per unit of generated revenue, allowing for an assessment of the premium paid for sales volumes regardless of current profit. By analyzing the P/S ratio dynamics of EZFill Holdings Inc. (EZFL), an investor can see how the market currently prices in the expansion of the mobile refueling service in Florida, ignoring operating losses in favor of future growth rates.

Who EZFill Holdings Inc. competes with

P/S Multiple Union Pacific Corporation (UNP)|Price-to-Revenue Ratio Prologis Corp PLD|CP: Market Cap to Revenue Ratio|NSC - Price-to-Revenue Ratio|CSX (CSX Corp) - Market Cap to Revenue Ratio|CNI: P/S Multiple|Market Cap to Revenue PACCAR|PSA (Public Storage Corp) - P/S Multiple|C.H. Robinson Worldwide (CHRW) - Price-to-Revenue Coefficient|Price-to-Revenue Ratio XPO Corp (XPO)|P/S Multiple amerco.com (UHAL)|P/S Multiple SAIA (Saia LTL Freight)|TFII: Market Cap to Revenue Ratio|R: Market Cap to Revenue|Price-to-Revenue Coefficient Knight-Swift Transportation KNX|General American Transportation Corporation (GATX) - Price-to-Revenue Ratio|Landstar - Market Capitalization-to-Revenue Ratio|Price-to-Revenue Ratio Schneider National|Market Cap to Revenue Ratio RXO (rxo.com)|P/S Multiple TRN|Market Cap to Sales Volume WERN|Price-to-Revenue Ratio distributionsolutionsgroup.com DSGR|Market Capitalization-to-Revenue Ratio SCSC|HTLD: Market Cap to Revenue|HY (Hyster-Yale, Inc.) - Market Cap to Revenue Ratio|ULH: P/S Multiple|CVLG - Price-to-Revenue Coefficient|Price-to-Revenue Ratio Wabash National|owens-minor.com (OMI) - Price-to-Revenue Coefficient|P/S Multiple RLGT|PAMT - Price to Sales|Price-to-Revenue Ratio Proficient Auto PAL|Price-to-Revenue Coefficient FreightCar America, Inc (RAIL)|YGMZ - Price-to-Revenue Ratio|Price-to-Revenue Coefficient Eastern International ELOG|HXHX (Haoxin Holdings Ltd) - Market Cap to Revenue|Addentax - Market Capitalization-to-Revenue Ratio|Market Cap to Revenue CTNT|Market Cap to Revenue Ratio NKLA (Nikola Motor Company)|Price-to-Revenue Ratio P.A.M. Transportation Services, Inc. (PTSI)|Price-to-Revenue Coefficient Daseke