Sow Good Inc (SOWG): Growth-Adjusted P/E Ratio

Symbol and logo of brand Sow Good, Inc. (SOWG)

Localizing production in the US minimizes external risks, which supports price stability. The PEG ratio confirms this trend, with the current level sitting around 0.00. Sow Good Inc. generates revenue through the sale of innovative freeze-dried desserts. Price action is driven by the scaling of its retail presence and the effectiveness of viral online promotion.

Sow Good, Inc. (SOWG): Price/Earnings to Growth Ratio from 05/03/2024 to 11/12/2026
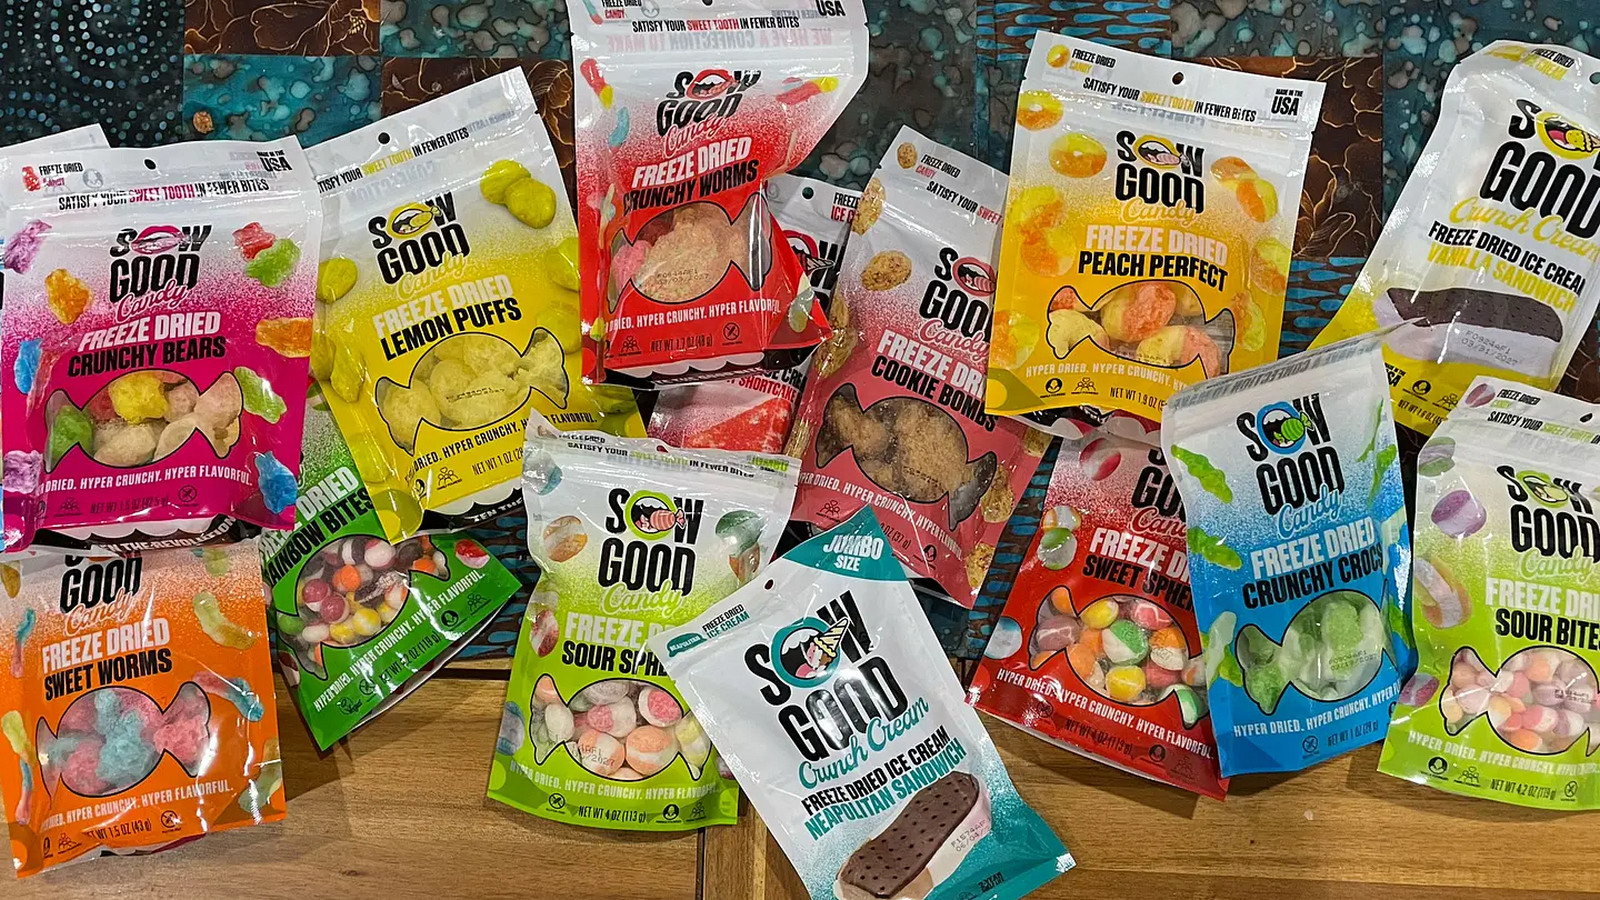
Finished products of Sow Good, Inc.

Professional capital evaluates Sow Good Inc. (SOWG) through the lens of profit scaling efficiency. This indicator compares the asset's market value with its expansion dynamics, identifying undervaluation when values fall below one. By analyzing the PEG ratio, an investor determines the cost of each percentage of earnings growth. For this niche leader in freeze-dried snacks, this is a critical marker of the pace of US retail penetration. Low values confirm "rocket" potential, provided the business model remains sustainable.

Who Sow Good Inc. competes with

Growth-Adjusted Market Cap to Net Income Kraft Heinz Company|Price/Earnings to Growth Ratio Kellanova Company K|GIS: Growth-Adjusted P/E Ratio|McCormick & Company - PEG Multiple|Growth-Adjusted Market Cap to Net Income JBS N.V. JBS|Hormel Foods (HRL) - Price/Earnings to Growth Ratio|SJM - Growth-Adjusted Market Cap to Net Income|PPC (Pilgrim's Corp) - PEG Multiple|CPB: Growth-Adjusted Payback Ratio|PEG Multiple SFD|INGR - Price to Earnings Adjusted for Growth Rate|PEG Multiple LW (Lamb Weston Holdings Inc)|BRFS: Growth-Adjusted P/E Ratio|POST: Price/Earnings to Growth Multiple|Growth-Adjusted Payback Ratio MZTI (Marzetti)|BRBR: PEG Multiple|Market Cap to Earnings and Growth Ratio TR (tootsie.com)|Price/Earnings to Growth Ratio Flowers Foods|Price to Earnings Adjusted for Growth Rate Simply Good Foods Co. SMPL|Price/Earnings to Growth Ratio Nomad Foods Corp (NOMD)|KLG - Price to Earnings Adjusted for Growth Rate|PEG Multiple JJSF (J&J Snack Foods)|UTZ: Growth-Adjusted P/E Ratio|THS - Price/Earnings to Growth Ratio|Growth-Adjusted Market Cap to Net Income SunOpta Inc STKL|jbssinc.com (JBSS) - Price/Earnings to Growth Ratio|Price to Earnings Adjusted for Growth Rate Seneca Foods Company (SENEA)|Price/Earnings to Growth Multiple LWAY|Price/Earnings to Growth Multiple mamascreations.com (MAMA)|Price/Earnings to Growth Multiple BGS (B&G Foods)|BYND (beyondmeat.com) - Growth-Adjusted Payback Ratio|PEG Multiple HAIN (Hain Celestial)|Price to Net Income Growth Ratio Bridgford|WYHG - Price/Earnings to Growth Ratio|Price to Earnings Adjusted for Growth Rate Laird Superfood Inc.|Borealis Foods Inc. (BRLS) - Price/Earnings to Growth Ratio|Price to Earnings Adjusted for Growth Rate Farmer Bros. (FARM)|BOF (BranchOut Food, Inc.) - PEG Multiple|Growth-Adjusted P/E Ratio PFAI (Pinnacle Food)|Price/Earnings to Growth Multiple TWG (Top Wealth Group Holding)|STKH (steakholderfoods.com) - Growth-Adjusted Payback Ratio|PEG Multiple BSFC (Blue Star Foods Corp.)|Growth-Adjusted Market Cap to Net Income Whole Earth Brands Inc. (FREE)|LANC - Price/Earnings to Growth Ratio|RGF (Real Good Foods) - Growth-Adjusted P/E Ratio|SNAX: PEG Multiple|Price/Earnings to Growth Multiple sovosbrands.com