SOWG: Sow Good Inc. Market Cap to Revenue Ratio
Corporate company logo of Sow Good Inc. (SOWG)

The rapid growth of the freeze-dried sweets segment opens a path for Sow Good Inc. (SOWG) to achieve a large-scale expansion of its distribution network. The P/S ratio confirms this trend, where 5.10 indicates the current valuation level. Stable demand for affordable desserts ensures resilience, although profit remains dependent on sugar prices, electricity costs, and the effectiveness of SMM promotion.

SOWG: thisissowgood.com P/S Multiple 05/03/2024 - 11/13/2026

Metric breakdowns and analytics for Sow Good Inc. (SOWG)
- current quotes and average value forecast:
General company analysis:Sow Good Inc (SOWG)
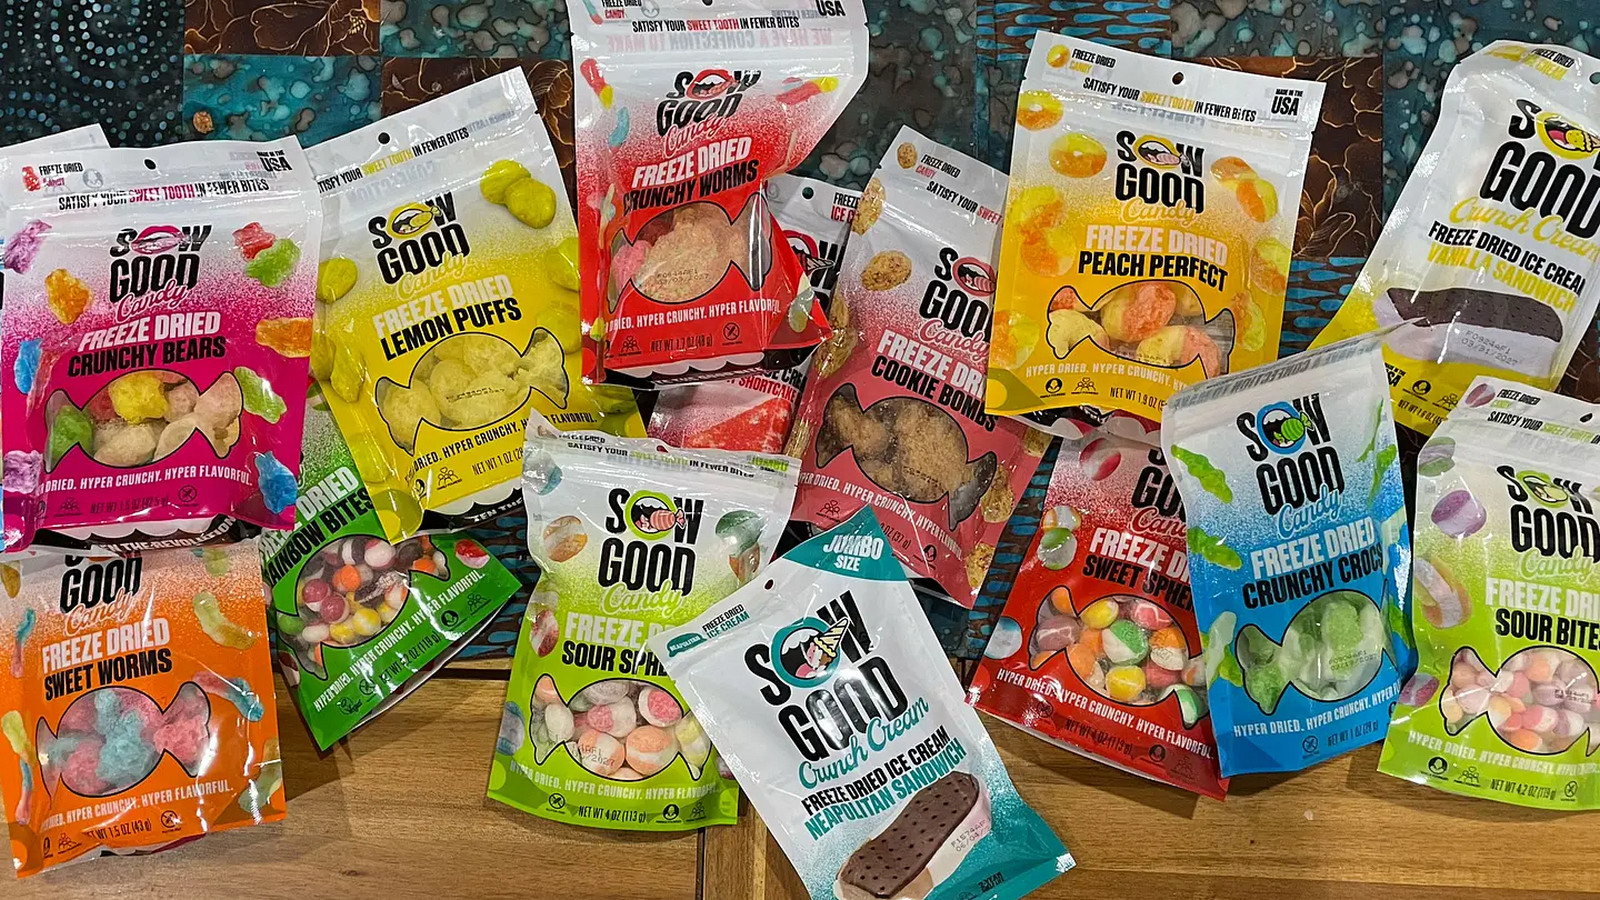
Mass-produced product of Sow Good, Inc.

The P/S ratio determines the market value of a business through its total sales volume, measuring the premium investors are willing to pay per unit of revenue. The dynamics of this multiple help identify an overbought asset and assess the risks of entering at historical highs. By analyzing the P/S ratio of the company, one can compare the market capitalization of Sow Good Inc. (SOWG) with the efficiency of its healthy snack sales. Diversification of distribution through e-commerce and retail makes this metric a key indicator of the business valuation's resilience.

Competitors of Sow Good Inc.

KHC - Price to Sales|P/S Multiple K (Kellogg's)|GIS: Market Cap to Revenue Ratio|MKC: Market Cap to Revenue|Market Capitalization-to-Revenue Ratio JBS (JBS N.V.)|HRL: P/S Multiple|Price-to-Sales Ratio SJM (jmsmucker.com)|Price-to-Revenue Ratio Pilgrim's Pride Corporation|Price to Sales Campbell Soup CPB|Price-to-Revenue Ratio Smithfield Foods, Inc. (SFD)|INGR - Price to Sales|P/S Multiple LW (Lamb Weston Holdings)|BRFS: Market Cap to Revenue Ratio|POST - Price-to-Revenue Ratio|Price-to-Revenue Coefficient The Marzetti Company MZTI|BellRing Brands Inc (BRBR) - Price-to-Revenue Ratio|Price to Sales Tootsie Roll Corp (TR)|Market Cap to Revenue FLO|Market Cap to Revenue The Simply Good Foods (SMPL)|Market Cap to Revenue NOMD (Nomad Foods)|KLG (WK Kellogg Corporation) - Market Capitalization-to-Revenue Ratio|P/S Multiple JJSF (J&J Snack Foods Corp.)|Price-to-Revenue Multiple Utz Brands Corp|THS - Price-to-Revenue Ratio|Price to Sales sunopta.com|jbssinc.com (JBSS) - Price-to-Revenue Ratio|Price to Sales Seneca Foods Corp (SENEA)|LWAY (Lifeway Kefir) - P/S Multiple|Market Cap to Revenue Ratio MAMA (Mama's Creations Corp)|Market Cap to Revenue BGS (B&G Foods, Inc.)|BYND (beyondmeat.com) - Market Capitalization-to-Revenue Ratio|P/S Multiple HAIN (The Hain Celestial Group)|Price-to-Revenue Coefficient Bridgford Foods Corp. (BRID)|WYHG - Price-to-Revenue Ratio|LSF (lairdsuperfood.com) - Market Cap to Revenue Ratio|BRLS: P/S Multiple|Market Cap to Revenue Farmer Bros.|Market Cap to Revenue BOF|Pinnacle Food (PFAI) - Price-to-Revenue Coefficient|Price-to-Revenue Ratio Top Wealth Group Holding Ltd (TWG)|Price-to-Revenue Coefficient Steakholder Foods Corp|Price-to-Revenue Ratio Blue Star Foods Corp. BSFC|Whole Earth Brands Inc. (FREE) - Price to Sales|LANC: Market Cap to Revenue|Real Good Food (RGF) - Market Cap to Revenue|SNAX: P/S Multiple|Price-to-Revenue Multiple Sovos Brands Corp SOVO