SOVO: Sovos Brands Corp Market Cap to Revenue Ratio
Corporate company logo of Sovos (SOVO)

High premium brand recognition and strict FDA oversight create a robust defensive barrier, driving a strategy of scaling and logistics optimization for Sovos Brands, Inc. (SOVO). The P/S ratio dynamics for Sovos Brands, Inc. (SOVO) confirm this trajectory, with the current value standing at 2.30. The overall picture is completed by a focus on clean labels and value-based marketing, which transform the quality of natural ingredients into a key competitive advantage.

SOVO: Sovos Brands Corp P/S Multiple 07/04/2022 - 03/23/2024

Metric breakdowns and analytics for Sovos Brands Inc (SOVO)
- current quotes and average value forecast:
General company analysis:Sovos Brands Inc (SOVO)
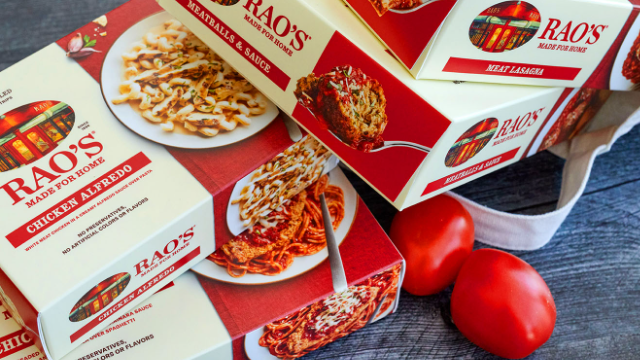
Mass-produced product of Sovos Brands

Analyzing Sovos Brands, Inc. (SOVO) through the P/S ratio chart allows for an assessment of the business's market value relative to its annual sales. This ratio is calculated as the relationship between market capitalization and revenue, reflecting the premium for the company's expansion into the premium sauce segment, which ultimately confirmed the asset's high investment attractiveness during its acquisition by a major food holding.

Competitors of Sovos Brands, Inc.

Kraft Heinz Corp - Market Cap to Revenue Ratio|Price-to-Revenue Ratio kelloggcompany.com K|Market Capitalization-to-Revenue Ratio GIS|McCormick & Co. - P/S Multiple|Price-to-Sales Ratio JBS|Hormel Corp (HRL) - Price-to-Revenue Ratio|Price to Sales J.M. Smucker (SJM)|Price-to-Revenue Ratio pilgrims.com|Price to Sales Campbell Soup Co. CPB|P/S Multiple SFD|INGR - Price to Sales|P/S Multiple LW (lambweston.com)|BRFS: Market Cap to Revenue Ratio|POST - Price-to-Revenue Ratio|T. Marzetti Company - Market Cap to Sales Volume|BRBR: P/S Multiple|TR: Market Cap to Sales Volume|Market Cap to Revenue FLO|Price to Sales The Simply Good Foods Company SMPL|P/S Multiple NOMD|KLG - Price to Sales|Price-to-Revenue Ratio jjsnack.com JJSF|Market Capitalization-to-Revenue Ratio UTZ|THS: Market Cap to Revenue|SunOpta - Market Cap to Sales Volume|JBSS (John B. Sanfilippo & Son) - Market Cap to Revenue|Seneca Foods (SENEA) - P/S Multiple|Market Cap to Revenue LWAY|MAMA: Market Capitalization-to-Revenue Ratio|Market Cap to Revenue BGS (B&G Foods)|BYND - Price to Sales|P/S Multiple HAIN (Hain Celestial Group)|Market Capitalization-to-Revenue Ratio BRID|WYHG - Price-to-Revenue Ratio|Price-to-Sales Ratio LSF|Borealis Foods, Inc. (BRLS) - Price-to-Revenue Ratio|FARM - Price-to-Revenue Coefficient|BOF (BranchOut Food) - P/S Multiple|Market Cap to Revenue Ratio PFAI (Pinnacle Food Group Inc.)|Price-to-Revenue Ratio Sow Good, Inc. (SOWG)|P/S Multiple imperialcristalcaviar.com (TWG)|Price-to-Revenue Ratio Steakholder Foods Corp STKH|Price-to-Revenue Coefficient Blue Star Foods Corporation (BSFC)|FREE - Price-to-Revenue Ratio|Price to Sales T. Marzetti|RGF: P/S Multiple|SNAX - Price-to-Revenue Coefficient