Sovos (SOVO) - Business Payback Period
Sovos Brands Inc - graphic logo of issuer SOVO

Sovos Brands, Inc. (SOVO) revenues are based on the market price of ingredients for premium sauces and the stability of transport routes. Business expansion is driven by the digitalization of logistics and the acquisition of new retail chains, despite the capital intensity of the plants. The asset value tracked on this chart, reaching 77.30, confirms the successful integration of the premium Rao's line into the Campbell Soup behemoth to strengthen market influence.

Sovos Brands - SOVO P/E Multiple (period 07/04/2022 - 03/23/2024)

Comprehensive metric breakdowns and analytics for Sovos Brands, Inc. (SOVO)
- stock price and consensus target price:
- market capitalization indicators:
Summary company analysis:SOVO (Sovos Brands)
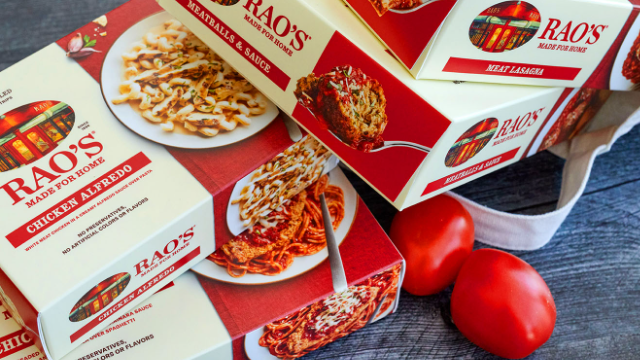
Manufactured product of Sovos Brands Corp

Investors must evaluate an asset's market value relative to its actual ability to generate profit. The P/E ratio is calculated by dividing the market capitalization of Sovos Brands, Inc. (SOVO) by its net income, determining the payback period for the investment. By analyzing the P/E ratio dynamics of Sovos Brands, Inc. (SOVO), one can identify price deviations from fundamental value. Stable demand for premium Rao's sauces ensures a predictable cash flow. Such business resilience makes this indicator a reliable tool for long-term planning.

Key competitors

Kraft Heinz Company (KHC) - Business Payback Period|Price to Earnings Ratio Kellanova Corp (K)|General Mills Corp - Price to Earnings Multiple|P/E Multiple MKC (mccormickcorporation.com)|Business Payback Period JBS N.V. (JBS)|HRL - Price to Earnings Ratio|Business Payback Period Smucker's SJM|PPC: P/E Multiple|Campbell Soup Co. - Company Value to Net Income|SFD (Smithfield) - P/E Multiple|INGR: Company Value to Net Income|Price to Earnings Ratio LW (Lamb Weston Holdings, Inc.)|BRFS - Market Cap to Earnings|P/E Multiple POST (Post Holdings, Inc.)|MZTI: Price to Earnings Multiple|BRBR: Price to Earnings Ratio|Market Cap to Earnings tootsie.com|Flowers Foods Corp (FLO) - Price to Earnings Ratio|Market Cap to Net Income SMPL (Simply Good Foods Co.)|Price to Earnings Ratio nomadfoods.com|Market Cap to Earnings WK Kellogg Corp KLG|Price to Earnings Ratio J&J Snack Foods Corp (JJSF)|Utz - Price to Earnings Multiple|TreeHouse Foods, Inc. - Price to Earnings Ratio|STKL: Price to Earnings Multiple|JBSS - Price to Earnings Ratio|SENEA (Seneca Foods Company) - Price to Earnings Multiple|LWAY: P/E Multiple|mamascreations.com (MAMA) - P/E Multiple|Price to Earnings Ratio BGS|Market Cap to Earnings beyondmeat.com BYND|Price to Earnings Ratio HAIN (Hain Celestial)|Bridgford Foods Corp - Price to Earnings Multiple|Wing Yip Food - Price to Earnings Ratio|Company Value to Net Income LSF|BRLS - Price to Earnings Ratio|Company Value to Net Income FARM (Farmer Bros Co)|BOF (BranchOut Food) - Price to Earnings Ratio|PFAI (Pinnacle Food Group Inc) - Price to Earnings Ratio|SOWG (Sow Good) - P/E Multiple|TWG (Top Wealth Group Holding) - Market Price to Net Income Ratio|P/E Multiple STKH|BSFC (Blue Star Foods Corporation) - Company Value to Net Income|Whole Earth Brands, Inc. - Price to Earnings Ratio|Company Value to Net Income LANC|RGF - Price to Earnings Ratio|SNAX (stryve.com) - Price to Earnings Multiple