General Mills, Inc. (GIS) Net Margin

Corporate company logo of General Mills, Inc. (GIS)

Stable demand for consumer staples guarantees capital stability for General Mills, Inc. (GIS), with the indicator settling at -4.90. The net profit margin confirms this trend. The business relies on a global brand network supported by powerful logistics that create barriers for retailers. This advantage is further solidified by expansion into the premium pet food segment, enabling the company to maintain strict pricing power on store shelves.

General Mills Company (GIS) - Net Return on Sales from 07/04/2022 to 11/19/2026

Analytical breakdowns for General Mills, Inc.
- market value and analyst target forecast:
Summary company analysis:General Mills Company - GIS
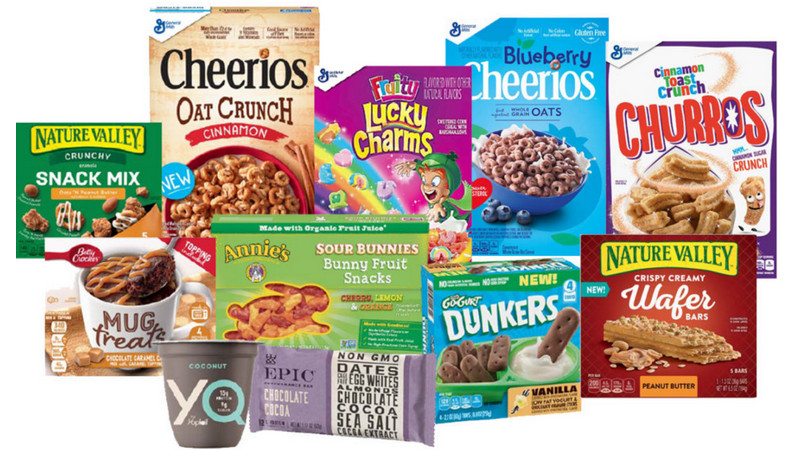
Flagship merchandise of General Mills Corp

The monetization efficiency of General Mills, Inc. (GIS) brands across the food and pet food segments is reflected in the net profit margin relative to total revenue. By analyzing the core net margin on the GURU.Markets platform, an investor assesses the company's ability to transform operational sales into actual income, allowing for an objective measurement of fundamental profitability and the business model's resilience to costs.

Analysis of competing companies

Kraft Foods (KHC) - Net Margin|Net Return on Sales K|Net Margin mccormickcorporation.com|Net Margin JBS N.V. JBS|Net Sales Margin HRL|Smucker's - Net Return on Sales|Net Margin Pilgrim's Pride PPC|CPB - Return on Sales by Net Profit|SFD - Net Margin|Company Sales Margin Corn Products International INGR|LW: Net Sales Margin|BRF S.A. - Net Profit Rate|Net Margin Post Holdings Inc|Net Margin T. Marzetti Company MZTI|Net Margin BellRing Brands Inc (BRBR)|Company Sales Margin Tootsie Roll Industries Inc|Net Margin Flowers Foods, Inc. FLO|Company Sales Margin Atkins (SMPL)|NOMD: Return on Sales by Net Profit|KLG: Net Margin|JJSF: Net Sales Margin|Net Return on Sales UTZ|THS (TreeHouse Foods Inc) - Net Sales Margin|STKL: Net Profit Rate|Net Margin Sanfilippo (JBSS)|SENEA: Net Profit Margin|Net Margin lifewaykefir.com LWAY|Net Sales Margin Mama's Creations, Inc. MAMA|BGS - Net Margin|Beyond Meat Inc - Company Net Profitability|The Hain Celestial Group (HAIN) - Net Margin|Net Margin Bridgford Foods Corp. (BRID)|WYHG (Wing Yip Food Holdings) - Net Sales Margin|Net Margin Laird Superfood LSF|Net Margin Borealis Foods, Inc. (BRLS)|Return on Sales by Net Profit Farmer Bros Co FARM|Net Sales Margin BOF (branchoutfood.com)|Net Profitability Margin Pinnacle Food Group|SOWG: Return on Sales by Net Profit|Net Profit Rate TWG (Top Wealth Group Holding Ltd)|steakholderfoods.com (STKH) - Net Margin|BSFC - Company Sales Margin|Net Margin Whole Earth Brands, Inc.|Net Sales Margin Lancaster Colony Corp|Net Sales Margin RGF|Stryve - Net Return on Sales|Sovos Brands, Inc. - Return on Sales by Net Profit