Farmer Bros Co (FARM): Growth-Adjusted P/E Ratio
Symbol and logo of brand Farmer Brothers (FARM)

The current P/E to growth dynamics for Farmer Bros. Co. (FARM) are based on the operations of US roasting plants that ensure stable B2B supplies. A strong reputation as a reliable partner in the restaurant sector confirms the brand's resilience. The level of 0.00 represents the current value of this indicator, while final returns remain moderately cyclical and sensitive to coffee commodity prices.

Farmer Brothers (FARM): Price/Earnings to Growth Ratio from 07/04/2022 to 05/16/2026
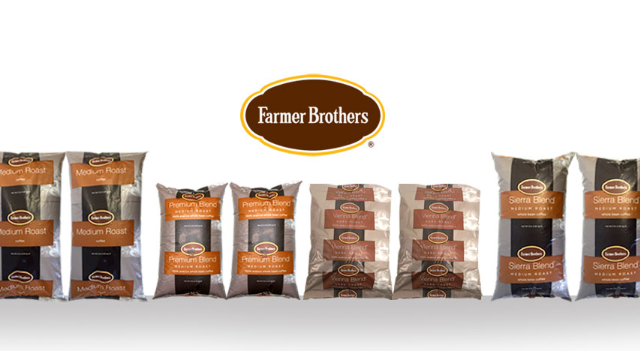
Finished products of Farmer Brothers

Coffee supplies to the HoReCa sector for Farmer Bros. Co. (FARM) are subject to the influence of tourist flows and commodity price volatility. The PEG ratio compares the current P/E ratio with the net profit growth rate, adjusting the valuation based on expansion speeds. Values below one signal that the asset is undervalued relative to its potential. It is critical for investors to consider the risk of capital stagnation when multipliers are low. Analyzing the current P/E to growth dynamics helps determine the entry point into the asset.

Who Farmer Bros. Co. competes with

Growth-Adjusted Market Cap to Net Income Kraft Heinz Company|Price/Earnings to Growth Ratio Kellanova Company K|GIS: Growth-Adjusted P/E Ratio|McCormick & Company - PEG Multiple|Growth-Adjusted Market Cap to Net Income JBS N.V. JBS|Hormel Foods (HRL) - Price/Earnings to Growth Ratio|SJM - Growth-Adjusted Market Cap to Net Income|PPC (Pilgrim's Corp) - PEG Multiple|CPB: Growth-Adjusted Payback Ratio|PEG Multiple SFD|INGR - Price to Earnings Adjusted for Growth Rate|PEG Multiple LW (Lamb Weston Holdings Inc)|BRFS: Growth-Adjusted P/E Ratio|POST: Price/Earnings to Growth Multiple|Growth-Adjusted Payback Ratio MZTI (Marzetti)|BRBR: PEG Multiple|Market Cap to Earnings and Growth Ratio TR (tootsie.com)|Price/Earnings to Growth Ratio Flowers Foods|Price to Earnings Adjusted for Growth Rate Simply Good Foods Co. SMPL|Price/Earnings to Growth Ratio Nomad Foods Corp (NOMD)|KLG - Price to Earnings Adjusted for Growth Rate|PEG Multiple JJSF (J&J Snack Foods)|UTZ: Growth-Adjusted P/E Ratio|TreeHouse Foods - PEG Multiple|Market Cap to Earnings and Growth Ratio STKL|JBSS: PEG Multiple|Seneca Foods Company (SENEA) - PEG Multiple|Price/Earnings to Growth Ratio Lifeway Foods, Inc.|MAMA: Growth-Adjusted Payback Ratio|Price/Earnings to Growth Ratio B&G Foods (BGS)|Price/Earnings to Growth Multiple beyondmeat.com BYND|PEG Multiple HAIN (Hain Celestial)|Bridgford (BRID) - Price to Earnings Adjusted for Growth Rate|WYHG - Price/Earnings to Growth Ratio|Growth-Adjusted Payback Ratio LSF (Laird Superfood Inc.)|BRLS (Borealis Foods Inc.) - Price/Earnings to Growth Multiple|BranchOut Food - Growth-Adjusted Payback Ratio|PFAI (Pinnacle Food Group Inc) - PEG Multiple|Price/Earnings to Growth Ratio SOWG|Price/Earnings to Growth Ratio Top Wealth Group Holding (TWG)|STKH (steakholderfoods.com) - Growth-Adjusted Payback Ratio|Price/Earnings to Growth Ratio Blue Star Foods Corp. BSFC|Whole Earth Brands Inc. (FREE) - Price to Earnings Adjusted for Growth Rate|LANC - Price/Earnings to Growth Ratio|Growth-Adjusted Market Cap to Net Income Real Good Foods RGF|SNAX (Stryve Foods, Inc.) - Price/Earnings to Growth Multiple|SOVO - Growth-Adjusted Market Cap to Net Income