Lamb Weston (LW): Growth-Adjusted Market Cap to Net Income

Symbol and logo of brand Lamb Weston Holdings, Inc. (LW)

Risks are linked to demand volatility in the food service sector, but the PEG ratio trend demonstrates a support level where 1.88 represents the current metric. Global distribution across retail and restaurants ensures stability. Growth potential is supported by a new ERP system and pricing discipline. Processing scale and long-term contracts with fast-food chains strengthen the market positions of Lamb Weston Holdings (LW).

LW: Lamb Weston PEG Multiple 07/04/2022 - 11/17/2026

Lamb Weston Holdings, Inc. (LW) - metric breakdowns and financial figures
- price and consensus price forecast:
General company analysis:Lamb Weston Holdings - LW
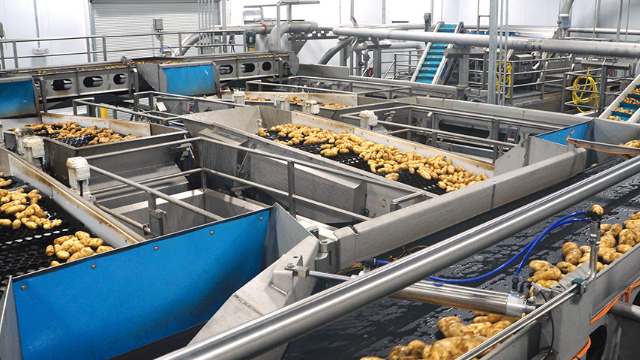
Manufactured products of Lamb Weston

Lamb Weston Holdings (LW) profit stability depends on agricultural cycles and demand within the fast-food sector, rendering the business valuation sensitive to external shocks. By comparing the current P/E to earnings expansion rates, the PEG ratio determines the fairness of the market price: a value below one signals that the asset is undervalued relative to its fundamental growth dynamics.

Competitors of Lamb Weston Holdings

Kraft Heinz Corp - Growth-Adjusted P/E Ratio|PEG Multiple K (Kellanova)|Growth-Adjusted Market Cap to Net Income generalmills.com (GIS)|MKC - Price/Earnings to Growth Ratio|Growth-Adjusted Market Cap to Net Income jbs.com.br JBS|HRL: PEG Multiple|Smucker - Growth-Adjusted Payback Ratio|PPC (Pilgrim's) - PEG Multiple|Price to Earnings Adjusted for Growth Rate Campbell Soup Company CPB|PEG Multiple SFD|INGR - Price to Earnings Adjusted for Growth Rate|PEG Multiple BRFS (BRF S.A.)|POST: Growth-Adjusted P/E Ratio|MZTI: Price/Earnings to Growth Multiple|Growth-Adjusted Payback Ratio BRBR (BellRing Brands, Inc.)|Tootsie Roll Corp (TR) - Price/Earnings to Growth Ratio|Price to Earnings Adjusted for Growth Rate Flowers Foods Inc (FLO)|Price/Earnings to Growth Ratio thesimplygoodfoodscompany.com|Price to Earnings Adjusted for Growth Rate Nomad Foods Group NOMD|PEG Multiple KLG|JJSF - Price to Earnings Adjusted for Growth Rate|utzsnacks.com - Price/Earnings to Growth Multiple|Company Value to Earnings Growth Ratio THS (TreeHouse Foods Inc)|STKL - Price/Earnings to Growth Ratio|John B. Sanfilippo & Son, Inc. - Company Value to Earnings Growth Ratio|senecafoods.com (SENEA) - Price/Earnings to Growth Ratio|LWAY - Growth-Adjusted Market Cap to Net Income|Price/Earnings to Growth Ratio Mama's Creations Inc|BGS: Growth-Adjusted Payback Ratio|Price/Earnings to Growth Ratio Beyond Meat, Inc. (BYND)|HAIN (Hain Celestial) - Growth-Adjusted Payback Ratio|PEG Multiple BRID (Bridgford)|Growth-Adjusted Payback Ratio WYHG|LSF - Price/Earnings to Growth Ratio|BRLS: Price/Earnings to Growth Ratio|FARM (Farmer Brothers) - Price/Earnings to Growth Multiple|BranchOut Food Inc. (BOF) - PEG Multiple|PFAI (Pinnacle Food Group Inc) - PEG Multiple|Growth-Adjusted P/E Ratio SOWG (Sow Good)|PEG Multiple TWG|Steakholder Foods - Growth-Adjusted P/E Ratio|Blue Star Foods - Price/Earnings to Growth Multiple|Company Value to Earnings Growth Ratio FREE (Whole Earth)|lancastercolony.com - PEG Multiple|Price to Earnings Adjusted for Growth Rate The Real Good Food Company|Stryve Foods Inc. (SNAX) - Price/Earnings to Growth Ratio|SOVO - Growth-Adjusted Market Cap to Net Income