J&J Snack Foods Inc (JJSF): Growth-Adjusted P/E Ratio
Symbol and logo of brand J&J Snack Foods Inc (JJSF)

J&J Snack Foods (JJSF) operates primarily within the US domestic market, which minimizes geopolitical risks while leaving only inflationary pressure on raw materials. Exclusive B2B frozen logistics create a robust defensive moat. The PEG ratio reflects the asset value dynamics, and this metric has reached the level of 47.60. Simultaneously, the company is implementing sustainable farming and safe refrigerants to reduce its climate impact.

J&J Snack Foods Corp. (JJSF): Price/Earnings to Growth Ratio from 07/04/2022 to 11/10/2026

Analytical breakdowns for J&J Snack Foods (JJSF)
General company analysis:J&J Snack Foods Corp (JJSF)
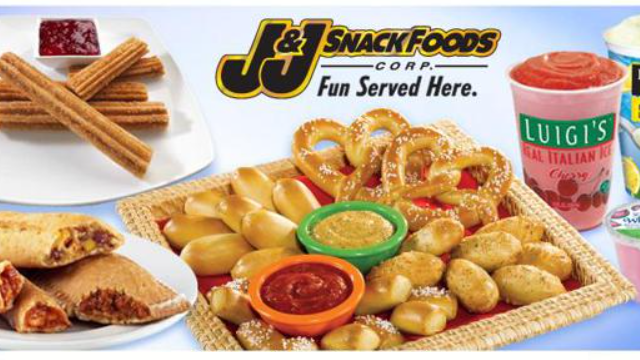
Finished products of J&J Snack Foods Corp.

To minimize risks when selecting an asset, one must compare the market value of earnings with their growth rate. This ratio, which divides P/E by the growth rate, reveals business undervaluation when the value is below one, making the PEG fundamental indicator a key efficiency filter. For J&J Snack Foods (JJSF), this metric confirms investment attractiveness against a backdrop of stable cash flow derived from its leadership in the snack segment.

Who J&J Snack Foods competes with

Growth-Adjusted Market Cap to Net Income Kraft Heinz Company|Price/Earnings to Growth Ratio Kellanova Company K|GIS: Growth-Adjusted P/E Ratio|McCormick & Company - PEG Multiple|Growth-Adjusted Market Cap to Net Income JBS N.V. JBS|Hormel Foods (HRL) - Price/Earnings to Growth Ratio|SJM - Growth-Adjusted Market Cap to Net Income|PPC (Pilgrim's Corp) - PEG Multiple|CPB: Growth-Adjusted Payback Ratio|PEG Multiple SFD|INGR - Price to Earnings Adjusted for Growth Rate|PEG Multiple LW (Lamb Weston Holdings Inc)|BRFS: Growth-Adjusted P/E Ratio|POST: Price/Earnings to Growth Multiple|Growth-Adjusted Payback Ratio MZTI (Marzetti)|BRBR: PEG Multiple|Market Cap to Earnings and Growth Ratio TR (tootsie.com)|Price/Earnings to Growth Ratio Flowers Foods|Price to Earnings Adjusted for Growth Rate Simply Good Foods Co. SMPL|Price/Earnings to Growth Ratio Nomad Foods Corp (NOMD)|KLG - Price to Earnings Adjusted for Growth Rate|PEG Multiple UTZ (Utz Brands, Inc.)|THS: Growth-Adjusted P/E Ratio|STKL - Price/Earnings to Growth Ratio|John B. Sanfilippo & Son - Company Value to Earnings Growth Ratio|Growth-Adjusted P/E Ratio Seneca Foods Corp.|LWAY: Company Value to Earnings Growth Ratio|Price/Earnings to Growth Ratio Mama's Creations, Inc.|BGS (bgfoods.com) - Company Value to Earnings Growth Ratio|Price/Earnings to Growth Multiple BYND (Beyond Meat, Inc.)|HAIN (The Hain Celestial Group, Inc.) - Growth-Adjusted Payback Ratio|Price/Earnings to Growth Ratio Bridgford Foods Corp BRID|Growth-Adjusted Market Cap to Net Income Wing Yip Food Holdings Group (WYHG)|LSF - Price/Earnings to Growth Ratio|BRLS (Borealis Foods, Inc.) - Growth-Adjusted P/E Ratio|FARM: PEG Multiple|BranchOut Food (BOF) - PEG Multiple|PFAI (Pinnacle Food Group Inc) - PEG Multiple|Price/Earnings to Growth Multiple Sow Good, Inc. (SOWG)|Price/Earnings to Growth Ratio Top Wealth Group Holding (TWG)|PEG Multiple steakholderfoods.com (STKH)|Blue Star Foods Corp. - Price/Earnings to Growth Multiple|Growth-Adjusted Payback Ratio FREE|Lancaster Colony Corp. - PEG Multiple|Market Cap to Earnings and Growth Ratio RGF|Stryve Foods, Inc. (SNAX) - Price/Earnings to Growth Ratio|Price to Earnings Adjusted for Growth Rate sovosbrands.com (SOVO)