JBS: JBS Group Growth-Adjusted Market Cap to Net Income
Symbol and logo of brand JBS Group (JBS)

JBS N.V. is striving for global leadership in the animal protein sector through asset diversification and acquisitions. The PEG ratio demonstrates the business's maturity stage, while 7.77 reflects the latest level of the metric. Tight management minimizes costs, and growing global demand for high-value-added proteins provides potential for long-term profit expansion.

JBS USA (JBS): PEG Multiple from 06/14/2025 to 11/12/2026
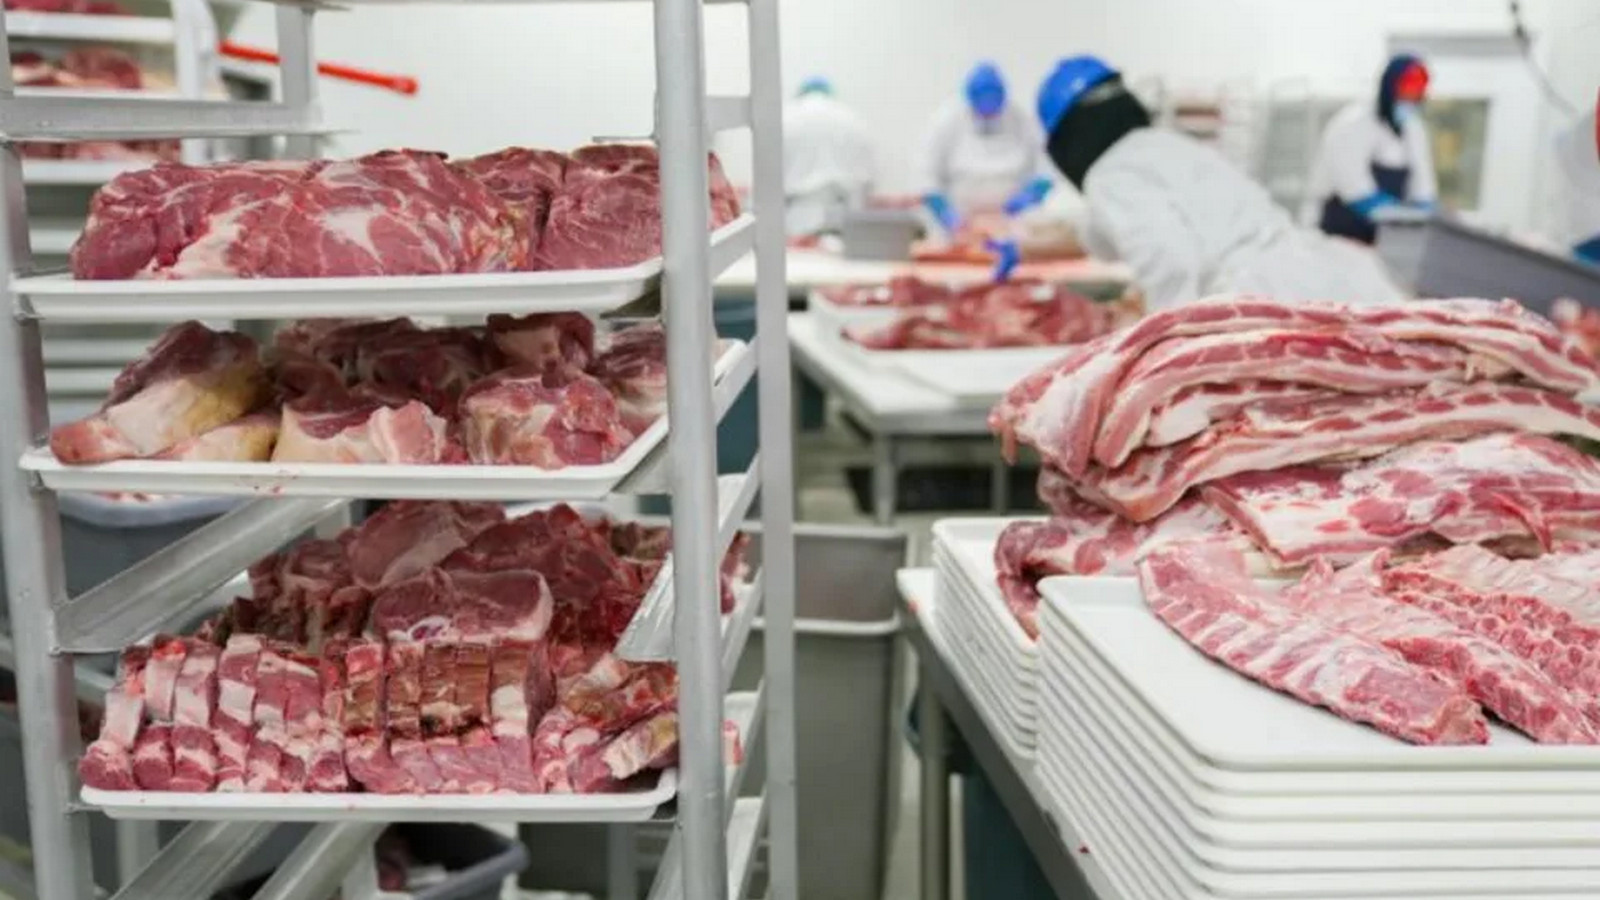
Mass-produced product of JBS USA

The large-scale implementation of robotic manipulators in JBS N.V. (JBS) meat processing optimizes costs, which is directly reflected in the growth stock undervaluation ratio with a current value of 7.77. This indicator compares the P/E ratio with earnings growth rates: a value below one signals that the asset is undervalued relative to its expansion, allowing the investor to filter out market noise and assess the fundamental sustainability of the trend.

Competing companies

Kraft Heinz Company - Growth-Adjusted P/E Ratio|PEG Multiple K (Kellanova Company)|Growth-Adjusted Market Cap to Net Income General Mills Company (GIS)|MKC - Price/Earnings to Growth Ratio|Growth-Adjusted Market Cap to Net Income hormelfoods.com HRL|SJM: PEG Multiple|Pilgrim's - Growth-Adjusted Payback Ratio|CPB (Campbell Soup Co.) - PEG Multiple|Price to Earnings Adjusted for Growth Rate Smithfield Foods Corp SFD|PEG Multiple INGR|Lamb Weston Holdings, Inc. - Growth-Adjusted P/E Ratio|BRF - Price/Earnings to Growth Multiple|Growth-Adjusted Payback Ratio POST|T. Marzetti Company - PEG Multiple|Market Cap to Earnings and Growth Ratio BRBR|Tootsie Roll Industries (TR) - Price/Earnings to Growth Ratio|Price to Earnings Adjusted for Growth Rate flowersfoods.com (FLO)|Price/Earnings to Growth Ratio The Simply Good Foods Company|Price to Earnings Adjusted for Growth Rate Nomad Foods Ltd NOMD|PEG Multiple KLG|J&J Snack Foods Inc - Growth-Adjusted P/E Ratio|Price/Earnings to Growth Ratio Utz Brands, Inc. UTZ|Company Value to Earnings Growth Ratio THS (treehousefoods.com)|SunOpta - PEG Multiple|JBSS: Price/Earnings to Growth Ratio|Seneca Foods Corp. (SENEA) - Price/Earnings to Growth Ratio|LWAY - Growth-Adjusted Market Cap to Net Income|Price/Earnings to Growth Multiple MAMA|BGS: Growth-Adjusted Payback Ratio|Price/Earnings to Growth Ratio Beyond Meat, Inc. (BYND)|The Hain Celestial Group, Inc. - Growth-Adjusted P/E Ratio|Bridgford Foods Corp - Price/Earnings to Growth Multiple|Growth-Adjusted Market Cap to Net Income Wing Yip Food Holdings Group (WYHG)|LSF: Price/Earnings to Growth Multiple|BRLS: Price/Earnings to Growth Ratio|FARM (farmerbros.com) - Price/Earnings to Growth Multiple|BOF - Growth-Adjusted Market Cap to Net Income|Price/Earnings to Growth Ratio Pinnacle Food Group Inc|SOWG (Sow Good, Inc.) - Company Value to Earnings Growth Ratio|PEG Multiple TWG|Price/Earnings to Growth Ratio STKH (steakholderfoods.com)|Price/Earnings to Growth Ratio Blue Star Foods Corp. BSFC|Growth-Adjusted Market Cap to Net Income Whole Earth Brands Inc. (FREE)|LANC - Price/Earnings to Growth Ratio|Growth-Adjusted Market Cap to Net Income Real Good Foods RGF|SNAX: PEG Multiple|Price to Earnings Adjusted for Growth Rate sovosbrands.com (SOVO)