Hain Celestial Group (HAIN): Growth-Adjusted P/E Ratio

Symbol and logo of brand Hain Celestial Group (HAIN)

Reliance on skilled technologists and marketers has enabled The Hain Celestial (HAIN) to develop its eco-product lines. The level of undervaluation based on the PEG ratio demonstrates price dynamics relative to earnings, where 0.00 captures the current state of the parameter. A strong portfolio of clean brands ensures stable demand, although debt leverage and competition from low-cost private labels create pressure on free cash flow.

Hain Celestial (HAIN): Price/Earnings to Growth Ratio from 07/04/2022 to 11/12/2026

Analytical breakdowns for The Hain Celestial (HAIN)
General company analysis:The Hain Celestial Group, Inc. (HAIN)
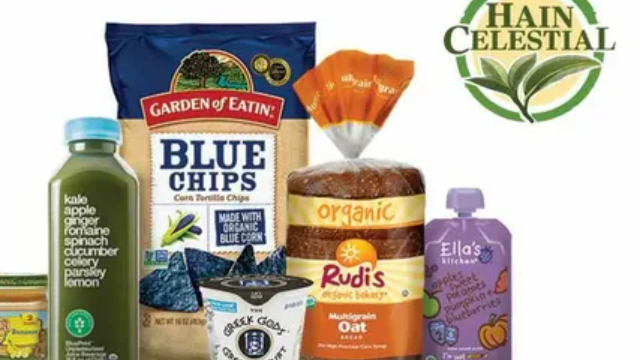
Finished products of Hain Celestial

The PEG ratio determines an asset's investment attractiveness by comparing the P/E multiple to earnings growth rates, where values below one signal fundamental undervaluation. By analyzing this valuation-to-earnings growth ratio, an investor can gauge the efficiency of The Hain Celestial (HAIN) within a mature organic products market and its ability to convert brand strength into value growth amidst fierce price competition.

Who The Hain Celestial competes with

Growth-Adjusted Market Cap to Net Income Kraft Heinz Company|Price/Earnings to Growth Ratio Kellanova Company K|GIS: Growth-Adjusted P/E Ratio|McCormick & Company - PEG Multiple|Growth-Adjusted Market Cap to Net Income JBS N.V. JBS|Hormel Foods (HRL) - Price/Earnings to Growth Ratio|SJM - Growth-Adjusted Market Cap to Net Income|PPC (Pilgrim's Corp) - PEG Multiple|CPB: Growth-Adjusted Payback Ratio|PEG Multiple SFD|INGR - Price to Earnings Adjusted for Growth Rate|PEG Multiple LW (Lamb Weston Holdings Inc)|BRFS: Growth-Adjusted P/E Ratio|POST: Price/Earnings to Growth Multiple|Growth-Adjusted Payback Ratio MZTI (Marzetti)|BRBR: PEG Multiple|Market Cap to Earnings and Growth Ratio TR (tootsie.com)|Price/Earnings to Growth Ratio Flowers Foods|Price to Earnings Adjusted for Growth Rate Simply Good Foods Co. SMPL|Price/Earnings to Growth Ratio Nomad Foods Corp (NOMD)|KLG - Price to Earnings Adjusted for Growth Rate|PEG Multiple JJSF (J&J Snack Foods)|UTZ: Growth-Adjusted P/E Ratio|THS: Price/Earnings to Growth Multiple|SunOpta Inc - Company Value to Earnings Growth Ratio|JBSS: PEG Multiple|Seneca Foods Company - Growth-Adjusted Payback Ratio|LWAY (Lifeway Foods, Inc.) - PEG Multiple|Price to Earnings Adjusted for Growth Rate mamascreations.com MAMA|Price/Earnings to Growth Multiple BGS (B&G Foods)|BYND (beyondmeat.com) - Growth-Adjusted Payback Ratio|PEG Multiple BRID (Bridgford Foods Corp)|Growth-Adjusted Payback Ratio WYHG|Laird Superfood - PEG Multiple|BRLS - PEG Multiple|FARM: PEG Multiple|BOF - Growth-Adjusted Market Cap to Net Income|Price/Earnings to Growth Ratio Pinnacle Food Group Inc|Growth-Adjusted P/E Ratio SOWG (Sow Good, Inc.)|Price/Earnings to Growth Multiple TWG (Top Wealth Group Holding)|STKH (steakholderfoods.com) - Growth-Adjusted Payback Ratio|PEG Multiple BSFC (Blue Star Foods Corp.)|FREE - Price/Earnings to Growth Multiple|Lancaster Colony Corp. - PEG Multiple|Price to Earnings Adjusted for Growth Rate Real Good Foods|Stryve Foods, Inc. (SNAX) - Price/Earnings to Growth Ratio|SOVO (sovosbrands.com) - Price/Earnings to Growth Ratio