Simply Good Foods (SMPL): Growth-Adjusted P/E Ratio
Symbol and logo of brand thesimplygoodfoodscompany.com (SMPL)

Competition in the diet products segment and inflationary pressure on raw materials create certain risks for The Simply Good Foods (SMPL). The PEG fair value trend confirms the asset's current position, where 59.68 represents the latest metric reading. Stable demand for fitness nutrition guarantees cash flow, while the dominance of the Quest and Atkins brands in the premium segment provides the company with powerful distribution.

Quest Nutrition (SMPL): Price/Earnings to Growth Ratio from 07/04/2022 to 11/11/2026

Analytical breakdowns for Simply Good Foods (SMPL)
- stock exchange capitalization data:
General company analysis:Atkins (SMPL)
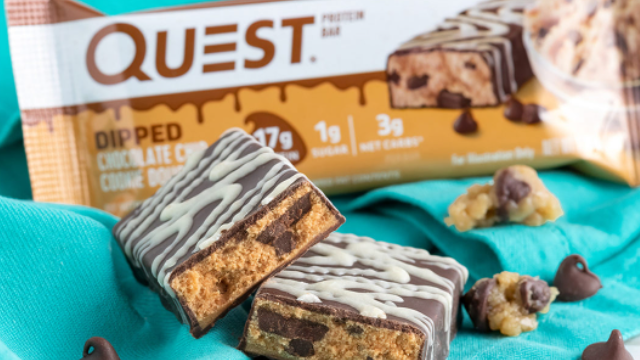
Finished products of Quest Nutrition

This ratio correlates the current P/E multiple with expected earnings growth rates, determining the cost per unit of future business growth. A value below one signals that the asset is undervalued, which is critical for The Simply Good Foods (SMPL) during the aggressive expansion of the Atkins and Quest product lines into the mass market. By analyzing the PEG ratio, an investor can assess the efficiency of the company's capture of the low-carb product market relative to the market value of its shares.

Who The Simply Good Foods competes with

Growth-Adjusted Market Cap to Net Income Kraft Heinz Company|Price/Earnings to Growth Ratio Kellanova Company K|GIS: Growth-Adjusted P/E Ratio|McCormick & Company - PEG Multiple|Growth-Adjusted Market Cap to Net Income JBS N.V. JBS|Hormel Foods (HRL) - Price/Earnings to Growth Ratio|SJM - Growth-Adjusted Market Cap to Net Income|PPC (Pilgrim's Corp) - PEG Multiple|CPB: Growth-Adjusted Payback Ratio|PEG Multiple SFD|INGR - Price to Earnings Adjusted for Growth Rate|PEG Multiple LW (Lamb Weston Holdings Inc)|BRFS: Growth-Adjusted P/E Ratio|POST: Price/Earnings to Growth Multiple|Growth-Adjusted Payback Ratio MZTI (Marzetti)|BRBR: PEG Multiple|Market Cap to Earnings and Growth Ratio TR (tootsie.com)|Price/Earnings to Growth Ratio Flowers Foods|Price to Earnings Adjusted for Growth Rate Nomad Foods Ltd NOMD|Price/Earnings to Growth Ratio WK Kellogg Corp (KLG)|JJSF - Price to Earnings Adjusted for Growth Rate|PEG Multiple UTZ (Utz Brands, Inc.)|THS: Growth-Adjusted P/E Ratio|STKL: Price/Earnings to Growth Multiple|John B. Sanfilippo & Son - Company Value to Earnings Growth Ratio|SENEA: PEG Multiple|Lifeway Corp - Growth-Adjusted Payback Ratio|MAMA (Mama's Creations, Inc.) - PEG Multiple|Price to Earnings Adjusted for Growth Rate bgfoods.com BGS|Price/Earnings to Growth Multiple BYND (Beyond Meat, Inc.)|HAIN (The Hain Celestial Group, Inc.) - Growth-Adjusted Payback Ratio|Price/Earnings to Growth Ratio Bridgford Foods Corp BRID|Growth-Adjusted Market Cap to Net Income Wing Yip Food Holdings Group (WYHG)|Laird Superfood - PEG Multiple|Growth-Adjusted Market Cap to Net Income Borealis Foods, Inc. BRLS|farmerbros.com (FARM) - Price/Earnings to Growth Ratio|Price/Earnings to Growth Multiple BranchOut Food|Price/Earnings to Growth Ratio Pinnacle Food Group Inc|Sow Good, Inc. - Market Cap to Earnings and Growth Ratio|Price/Earnings to Growth Ratio Top Wealth Group Holding (TWG)|Price/Earnings to Growth Ratio STKH (steakholderfoods.com)|Blue Star Foods Corp. - Price/Earnings to Growth Multiple|Whole Earth Brands Inc. (FREE) - Price to Earnings Adjusted for Growth Rate|LANC: Price/Earnings to Growth Multiple|Growth-Adjusted Payback Ratio RGF (Real Good Foods)|SNAX: PEG Multiple|Price to Net Income Growth Ratio sovosbrands.com SOVO