Post Corp (POST): Growth-Adjusted P/E Ratio
Symbol and logo of brand Post Corp (POST)

Post Holdings, Inc. (POST) management masterfully capitalizes on cheap loans to acquire and restructure brands, scaling the portfolio through expansion into the pet food segment. This PEG ratio chart demonstrates a balance between market demand and fundamental growth rates, where 2.08 serves as the final level marker. Business efficiency is bolstered by the robotization of mixing and packaging lines, which minimizes the impact of human error in production.

Post Consumer Brands (POST): Price/Earnings to Growth Ratio from 07/04/2022 to 11/12/2026

Analytical breakdowns for Post Holdings, Inc. (POST)
- price and consensus price forecast:
General company analysis:Post Holdings Inc (POST)
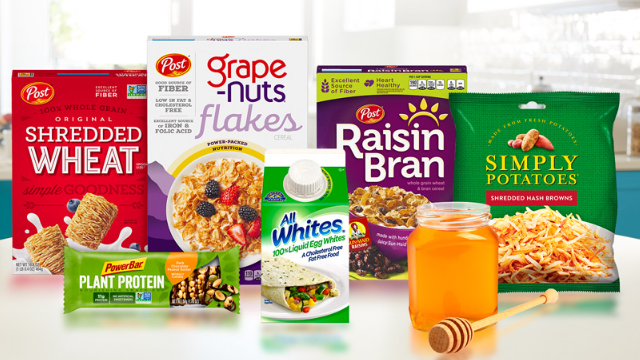
Finished products of Post Consumer Brands

The PEG ratio determines the fairness of the market price by comparing the current earnings multiple with the annual growth rate. By analyzing the current PEG value, an investor assesses the scaling efficiency of Post Holdings, Inc. (POST), where the diversification of agricultural raw materials minimizes operational risks and ensures steady revenue growth, making low metric readings a signal of the business's fundamental undervaluation.

Who Post Holdings, Inc. competes with

Growth-Adjusted Market Cap to Net Income Kraft Heinz Company|Price/Earnings to Growth Ratio Kellanova Company K|GIS: Growth-Adjusted P/E Ratio|McCormick & Company - PEG Multiple|Growth-Adjusted Market Cap to Net Income JBS N.V. JBS|Hormel Foods (HRL) - Price/Earnings to Growth Ratio|SJM - Growth-Adjusted Market Cap to Net Income|PPC (Pilgrim's Corp) - PEG Multiple|CPB: Growth-Adjusted Payback Ratio|PEG Multiple SFD|INGR - Price to Earnings Adjusted for Growth Rate|PEG Multiple LW (Lamb Weston Holdings Inc)|BRFS: Growth-Adjusted P/E Ratio|MZTI: Price/Earnings to Growth Multiple|Growth-Adjusted Payback Ratio BRBR (BellRing Brands Corp)|TR: PEG Multiple|Market Cap to Earnings and Growth Ratio FLO (flowersfoods.com)|Price/Earnings to Growth Ratio The Simply Good Foods Company|Price to Earnings Adjusted for Growth Rate Nomad Foods Ltd NOMD|Price/Earnings to Growth Ratio WK Kellogg Corp (KLG)|JJSF - Price to Earnings Adjusted for Growth Rate|PEG Multiple UTZ (Utz Brands, Inc.)|THS: Growth-Adjusted P/E Ratio|STKL - Price/Earnings to Growth Ratio|Market Cap to Earnings and Growth Ratio JBSS|Seneca Foods Corp. (SENEA) - Price/Earnings to Growth Ratio|Price to Earnings Adjusted for Growth Rate Lifeway Corp (LWAY)|Price/Earnings to Growth Ratio Mama's Creations, Inc.|bgfoods.com (BGS) - Growth-Adjusted Market Cap to Net Income|Price/Earnings to Growth Multiple BYND (Beyond Meat, Inc.)|Company Value to Earnings Growth Ratio HAIN|Bridgford Foods Corp - Price/Earnings to Growth Multiple|Growth-Adjusted Payback Ratio WYHG|Laird Superfood - PEG Multiple|Growth-Adjusted Payback Ratio BRLS (Borealis Foods, Inc.)|farmerbros.com (FARM) - Price/Earnings to Growth Ratio|Price to Earnings Adjusted for Growth Rate BranchOut Food (BOF)|Price/Earnings to Growth Ratio Pinnacle Food Group Inc|Price/Earnings to Growth Ratio SOWG|PEG Multiple TWG|steakholderfoods.com - Growth-Adjusted P/E Ratio|PEG Multiple BSFC (Blue Star Foods Corp.)|Growth-Adjusted Market Cap to Net Income Whole Earth Brands Inc. (FREE)|LANC - Price/Earnings to Growth Ratio|RGF (Real Good Foods) - Growth-Adjusted P/E Ratio|SNAX: PEG Multiple|Price to Net Income Growth Ratio sovosbrands.com SOVO