Hain Celestial (HAIN) - Business Payback Period

The Hain Celestial Group, Inc. - graphic logo of issuer HAIN

The Hain Celestial (HAIN) generates revenue from the production of organic convenience foods, implementing sustainability principles by reducing plastic and practicing mindful water resource management. The business model relies on outsourcing logistics and portions of the production cycles to third-party contractors. The current P/E ratio stands at 0.00, while the price chart on GURU.Markets reflects the asset's dynamics amid a moderate refresh of product lines.

The Hain Celestial Group - HAIN P/E Multiple (period 07/04/2022 - 11/14/2026)

Comprehensive metric breakdowns and analytics for Hain Celestial (HAIN)
- stock price and consensus target price:
Summary company analysis:HAIN (hain.com)
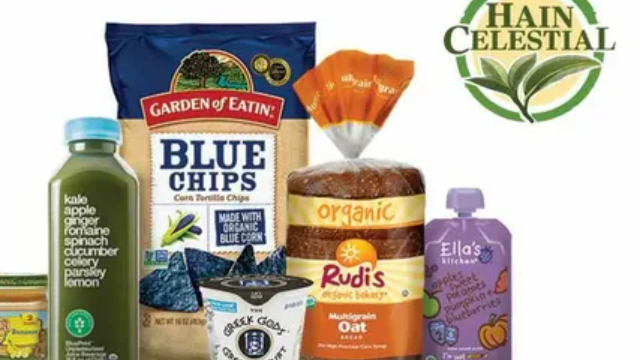
Manufactured product of Hain Celestial Group

The P/E ratio determines the market value of one dollar of net income, making it possible to identify whether an asset is overvalued relative to its earnings. For institutional portfolios, this indicator serves as a mechanical trigger for capital rebalancing between undervalued and expensive securities. By analyzing the P/E ratio dynamics, an investor can identify an entry point that minimizes the risk of buying at the peak. For The Hain Celestial (HAIN), such a valuation confirms business resilience driven by a diversified portfolio of organic brands.

Key competitors

kraftheinzcompany.com - Market Cap to Net Income|P/E Multiple K|Business Payback Period General Mills Inc|Price to Earnings Ratio McCormick & Co. MKC|JBS: Price to Earnings Multiple|Hormel Foods Corporation - P/E Multiple|Business Payback Period jmsmucker.com SJM|Pilgrim's Pride Corporation (PPC) - Price to Earnings Ratio|CPB - Business Payback Period|SFD (Smithfield Foods, Inc.) - P/E Multiple|INGR: Company Value to Net Income|P/E Multiple LW|BRFS - Market Cap to Earnings|P/E Multiple POST (Post Holdings)|MZTI: Price to Earnings Multiple|BRBR: Price to Earnings Ratio|Company Value to Net Income TR (Tootsie Roll Corp)|FLO: P/E Multiple|Market Cap to Net Income SMPL (Simply Good Foods)|Price to Earnings Ratio Nomad Foods|Market Cap to Earnings WK Kellogg Corporation KLG|Price to Earnings Ratio J&J Snack Foods Corp. (JJSF)|UTZ - Market Cap to Earnings|P/E Multiple THS (TreeHouse Foods, Inc.)|STKL: Price to Earnings Multiple|JBSS: Price to Earnings Ratio|Seneca Foods Corp - Market Price to Net Income Ratio|LWAY: P/E Multiple|Mama's Creations Corp - Company Value to Net Income|BGS (B&G Foods, Inc.) - P/E Multiple|Market Cap to Earnings Beyond Burger BYND|Price to Earnings Ratio BRID (Bridgford Foods Corporation)|WYHG (wingyip-food.com) - Company Value to Net Income|P/E Multiple LSF (Laird Superfood, Inc.)|Company Value to Net Income BRLS|Farmer Brothers - P/E Multiple|BOF - P/E Multiple|PFAI: P/E Multiple|SOWG - Business Payback Period|Price to Earnings Ratio Top Wealth Group Holding Ltd|Price to Earnings Multiple STKH (Steakholder Foods Corp)|Price to Earnings Ratio BSFC (Blue Star Foods)|FREE (wholeearthbrands.com) - Company Value to Net Income|P/E Multiple LANC (Lancaster Colony Corporation)|RGF - Price to Earnings Ratio|Stryve - P/E Multiple|Market Cap to Earnings Sovos Brands Corp