BSFC: Blue Star Foods Corp. Net Margin
Corporate emblem and logo of Blue Star Foods (BSFC)

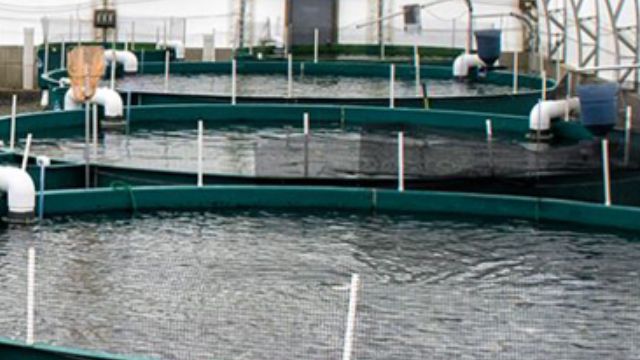
Blue Star Foods (BSFC) is optimizing logistics and reducing plastic usage for environmental reasons. The net profitability level of sales captures the dynamics of these costs, where the value of -82.30 reflects the metric's balance. However, raw material inflation and fishing bans create risks. Meanwhile, Blue Star Foods (BSFC) relies on innovative RAS systems, although weak pricing power limits revenue growth opportunities.

bluestarfoods.com (BSFC) Net Margin: for the period 07/04/2022 - 12/28/2024

Financial and market metric breakdowns for Blue Star Foods Corp. (BSFC)
- share price and expert price forecast:
Fundamental valuation:Blue Star Foods Corporation, BSFC
Flagship merchandise of bluestarfoods.com

The dynamics of this indicator directly reflect the operational efficiency of cost management. This metric determines the share of net profit that Blue Star Foods (BSFC) retains from every ruble earned after all deductions. For Blue Star Foods (BSFC), this calculation is critical due to seafood price volatility and logistics costs. Environmental quotas and processing quality directly impact final profitability. By analyzing the net profit margin, an investor assesses the business's resilience.

Competitor analysis

Kraft Foods (KHC) - Net Margin|Net Return on Sales K|Net Margin generalmills.com|Net Margin McCormick & Co. MKC|Net Sales Margin JBS|Hormel Foods Corporation - Net Return on Sales|The J. M. Smucker Company - Return on Sales by Net Profit|PPC (Pilgrim's Pride Corporation) - Net Profit Margin|Campbell Soup - Net Sales Margin|Smithfield Foods, Inc. (SFD) - Return on Sales by Net Profit|Ingredion (INGR) - Net Margin|LW (lambweston.com) - Net Margin|BRFS (BRF S.A.) - Net Sales Margin|Post Consumer Brands (POST) - Company Sales Margin|Return on Sales by Net Profit MZTI (T. Marzetti Company)|Net Margin BRBR (BellRing Brands Corp)|Net Sales Margin TR (Tootsie Roll Industries, Inc.)|Net Profit Rate FLO|The Simply Good Foods - Net Sales Margin|Net Profit Rate NOMD (Nomad Foods)|wkkellogg.com (KLG) - Net Margin|J&J Snack Foods Corp. (JJSF) - Net Sales Margin|UTZ (Utz) - Net Sales Margin|Net Margin TreeHouse Foods THS|Net Sales Margin STKL|Company Sales Margin John B. Sanfilippo & Son, Inc.|Net Margin senecafoods.com SENEA|Lifeway Corp (LWAY) - Net Margin|MAMA: Return on Sales by Net Profit|BGS (B&G Foods, Inc.) - Net Return on Sales|BYND (Beyond Burger) - Return on Sales by Net Profit|HAIN (The Hain Celestial Group) - Net Margin|Net Margin bridgford.com|Net Return on Sales WYHG (Wing Yip Food Holdings)|Net Sales Margin LSF|Company Sales Margin Borealis Foods|Net Margin Farmer Bros. FARM|Company Sales Margin BranchOut Food Inc. (BOF)|PFAI - Net Margin|thisissowgood.com (SOWG) - Return on Sales by Net Profit|TWG: Net Sales Margin|STKH - Company Sales Margin|Net Margin Whole Earth Brands, Inc.|Net Sales Margin Lancaster Colony Corp|Net Sales Margin RGF|Stryve - Net Return on Sales|Sovos Brands, Inc. - Return on Sales by Net Profit