LANC: Lancaster Colony Net Margin

Corporate emblem and logo of Lancaster Colony Corp (LANC)

Lancaster Colony (LANC) operates in the production of sauces and bakery products for chains, serving as a classic source of stable capital with resilient consumer demand. Current sales margins demonstrate the business's actual ability to protect profits, while 9.00 reflects the latest metric level. High diversification between retail and food service guarantees revenue reliability, and predictable cash flows confirm the issuer's exceptional financial stability.

T. Marzetti (LANC) Net Margin: for the period 07/04/2022 - 07/01/2025

Financial and market metric breakdowns for Lancaster Colony Corp. (LANC)
- share price and expert price forecast:
Initial company analysis:Lancaster Colony
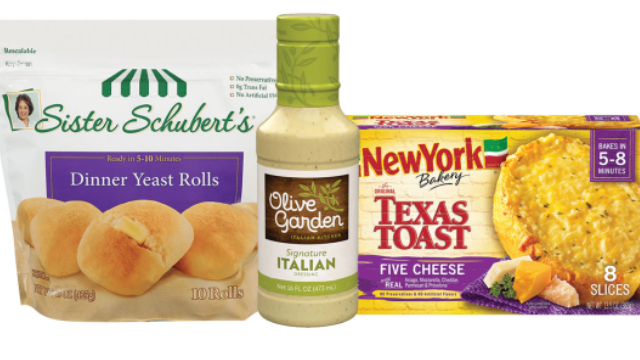
Manufactured product of Lancaster Colony Corp

Lancaster Colony (LANC) diversification of sales through retail and food service is reflected in the dynamics of financial sales margins. This indicator measures the share of net profit in the company's total revenue. A decline in this metric signals rising operating expenses or increased debt service costs. Falling profitability amid high interest rates directly threatens dividend payouts. A stable trend confirms the business model's resilience to external shocks.

Key competitors

Kraft Foods (KHC) - Net Margin|Net Return on Sales K|Net Margin generalmills.com|Net Margin McCormick & Co. MKC|Net Sales Margin JBS|Hormel Foods Corporation - Net Return on Sales|The J. M. Smucker Company - Return on Sales by Net Profit|PPC (Pilgrim's Pride Corporation) - Net Profit Margin|Campbell Soup - Net Sales Margin|Smithfield Foods, Inc. (SFD) - Return on Sales by Net Profit|Ingredion (INGR) - Net Margin|LW (lambweston.com) - Net Margin|BRFS (BRF S.A.) - Net Sales Margin|Post Consumer Brands (POST) - Company Sales Margin|Return on Sales by Net Profit MZTI (T. Marzetti Company)|Net Margin BRBR (BellRing Brands Corp)|Net Sales Margin TR (Tootsie Roll Industries, Inc.)|Net Profit Rate FLO|The Simply Good Foods - Net Sales Margin|Net Profit Rate NOMD (Nomad Foods)|wkkellogg.com (KLG) - Net Margin|J&J Snack Foods Corp. (JJSF) - Net Sales Margin|UTZ (Utz) - Net Sales Margin|Net Margin TreeHouse Foods THS|Net Sales Margin STKL|Company Sales Margin John B. Sanfilippo & Son, Inc.|Net Margin senecafoods.com SENEA|Lifeway Corp (LWAY) - Net Margin|MAMA: Return on Sales by Net Profit|BGS (B&G Foods, Inc.) - Net Return on Sales|BYND (Beyond Burger) - Return on Sales by Net Profit|HAIN (The Hain Celestial Group) - Net Margin|Net Margin bridgford.com|Net Return on Sales WYHG (Wing Yip Food Holdings)|Net Sales Margin LSF|Company Sales Margin Borealis Foods|Net Margin Farmer Bros. FARM|Company Sales Margin BranchOut Food Inc. (BOF)|PFAI - Net Margin|thisissowgood.com (SOWG) - Return on Sales by Net Profit|TWG: Net Sales Margin|STKH - Company Sales Margin|BSFC (Blue Star Foods Corporation) - Net Sales Margin|Whole Earth Brands (FREE) - Company Sales Margin|Net Sales Margin RGF|Stryve - Net Return on Sales|Sovos Brands, Inc. - Return on Sales by Net Profit