FARM: Farmer Bros. Net Margin
Corporate emblem and logo of Farmer Brothers (FARM)

Farmer Bros. Co. focuses on the premium segment within the saturated North American roasted coffee market. A century of experience and the trust of wholesale partners ensure high brand loyalty. The net profit margin visualizes the efficiency of the model, where -5.50 shows the level of this metric. Current results are based on global bean prices and demand in the food service industry.

farmerbros.com (FARM) Net Margin: for the period 07/04/2022 - 05/16/2026

Analytical breakdowns for farmerbros.com (FARM)
- share price and expert price forecast:
Initial company analysis:Farmer Bros. Co.
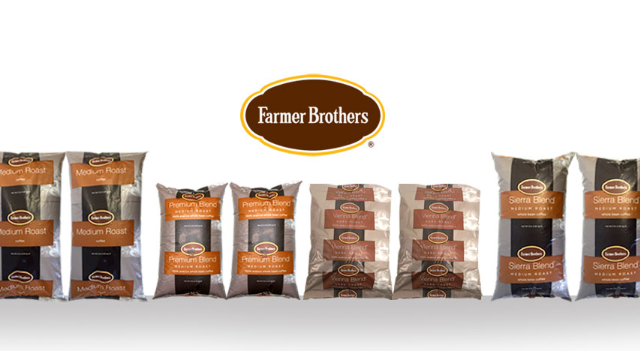
Flagship merchandise of Farmer Bros. Co.

Farmer Bros. Co. minimizes coffee distribution logistics costs through its own roasting plants and hubs. The efficiency of this infrastructure is reflected in the company's net margin, which measures the portion of profit remaining after all operating and tax deductions. The trend of this metric demonstrates the business's ability to convert revenue into actual income. Analyzing the curve allows for an assessment of the model's resilience to raw material price shocks. Investors use this indicator to determine the asset's fundamental value.

Who Farmer Bros. Co. competes with

Kraft Foods (KHC) - Net Margin|Net Return on Sales K|Net Margin generalmills.com|Net Margin McCormick & Co. MKC|Net Sales Margin JBS|Hormel Foods Corporation - Net Return on Sales|The J. M. Smucker Company - Return on Sales by Net Profit|PPC (Pilgrim's Pride Corporation) - Net Profit Margin|Campbell Soup - Net Sales Margin|Smithfield Foods, Inc. (SFD) - Return on Sales by Net Profit|Ingredion (INGR) - Net Margin|LW (lambweston.com) - Net Margin|BRFS (BRF S.A.) - Net Sales Margin|Post Consumer Brands (POST) - Company Sales Margin|Return on Sales by Net Profit MZTI (T. Marzetti Company)|Net Margin BRBR (BellRing Brands Corp)|Net Sales Margin TR (Tootsie Roll Industries, Inc.)|Net Profit Rate FLO|The Simply Good Foods - Net Sales Margin|Net Profit Rate NOMD (Nomad Foods)|wkkellogg.com (KLG) - Net Margin|J&J Snack Foods Corp. (JJSF) - Net Sales Margin|UTZ (Utz) - Net Sales Margin|Net Margin TreeHouse Foods THS|Net Sales Margin STKL|Company Sales Margin John B. Sanfilippo & Son, Inc.|Net Margin senecafoods.com SENEA|Lifeway Corp (LWAY) - Net Margin|MAMA: Return on Sales by Net Profit|BGS (B&G Foods, Inc.) - Net Return on Sales|BYND (Beyond Burger) - Return on Sales by Net Profit|HAIN (The Hain Celestial Group) - Net Margin|Net Margin bridgford.com|Net Return on Sales WYHG (Wing Yip Food Holdings)|Net Sales Margin LSF|Company Sales Margin Borealis Foods|Net Sales Margin BOF (branchoutfood.com)|Net Profitability Margin Pinnacle Food Group|SOWG: Return on Sales by Net Profit|Net Profit Rate TWG (Top Wealth Group Holding Ltd)|steakholderfoods.com (STKH) - Net Margin|BSFC - Company Sales Margin|Net Margin Whole Earth Brands, Inc.|Net Sales Margin Lancaster Colony Corp|Net Sales Margin RGF|Stryve - Net Return on Sales|Sovos Brands, Inc. - Return on Sales by Net Profit